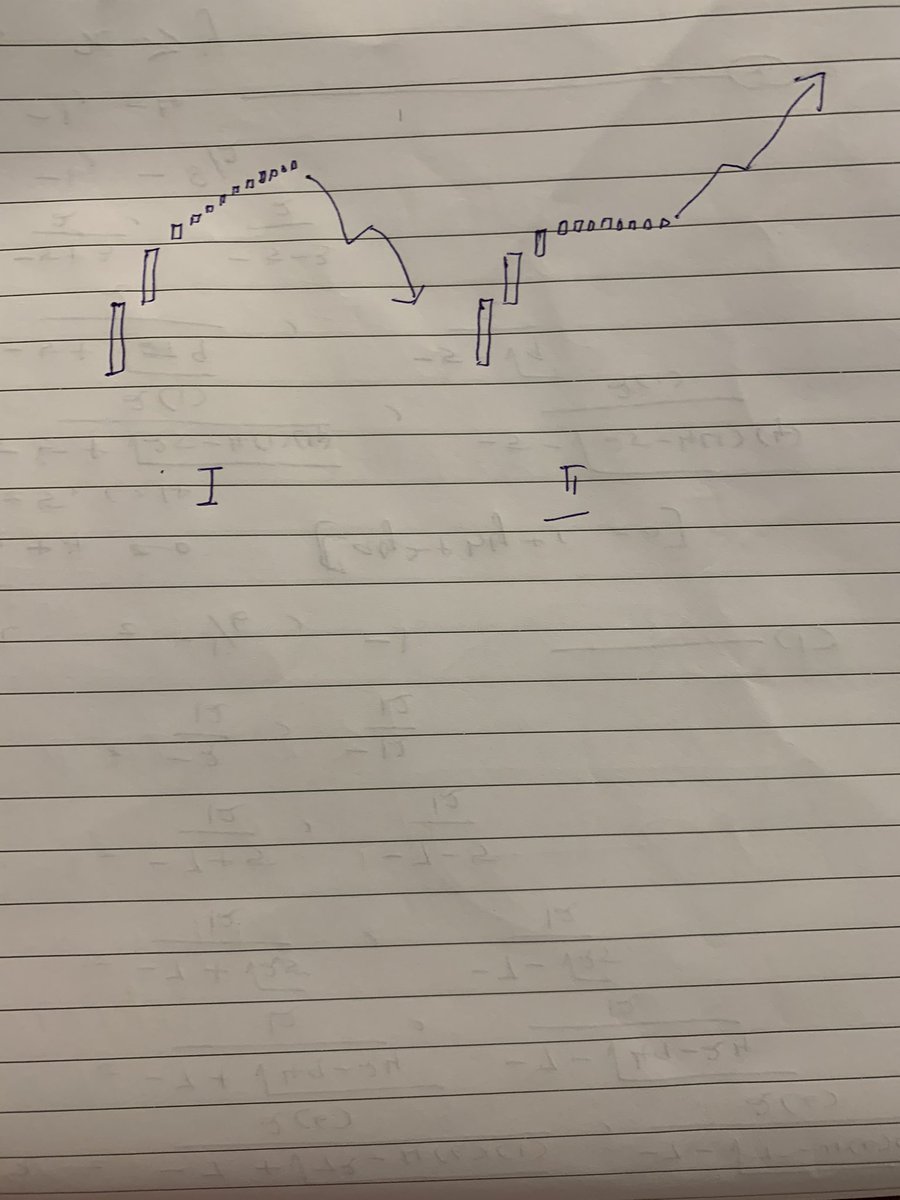
In such a case, H&S can be either a continuation pattern or compound fulcrum.
This is how to differentiate:
• if right shoulder is smaller than left, most likely a continuation H&S
• if right is same or higher than left, and the price is not coming to neckline, most likely CF
sir a doubt does head & shoulders work in down trend ? pic.twitter.com/dytYmbzOfp
— Vega_Greek (@VegaGreek) May 13, 2021
More from Piyush Chaudhry


#repost
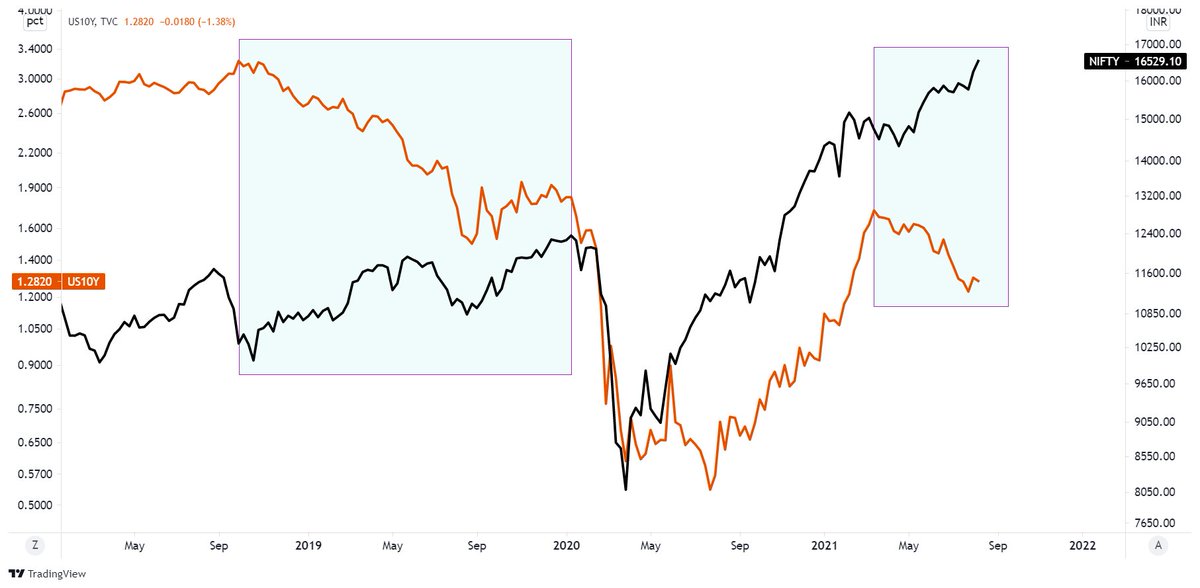
#NIFTY in Regression Channel.
— Piyush Chaudhry (@piyushchaudhry) April 30, 2022
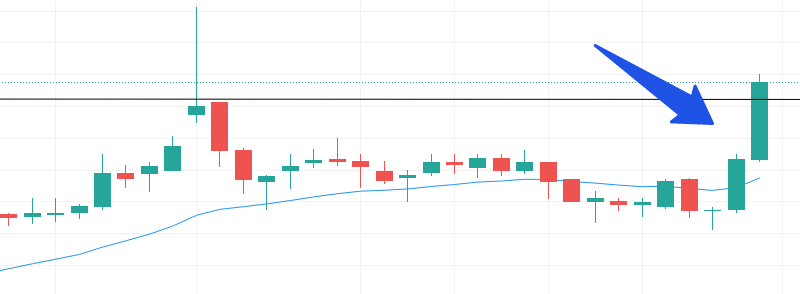
A rectangular consolidation around the central Line of Best Fit, with no such reversal characteristics on display yet.
For it to revisit the upper band, odds would increase only on a break above ~17450.
Else, it's a slippery slope. pic.twitter.com/4OT7JM1TJY

More from Stockslearnings


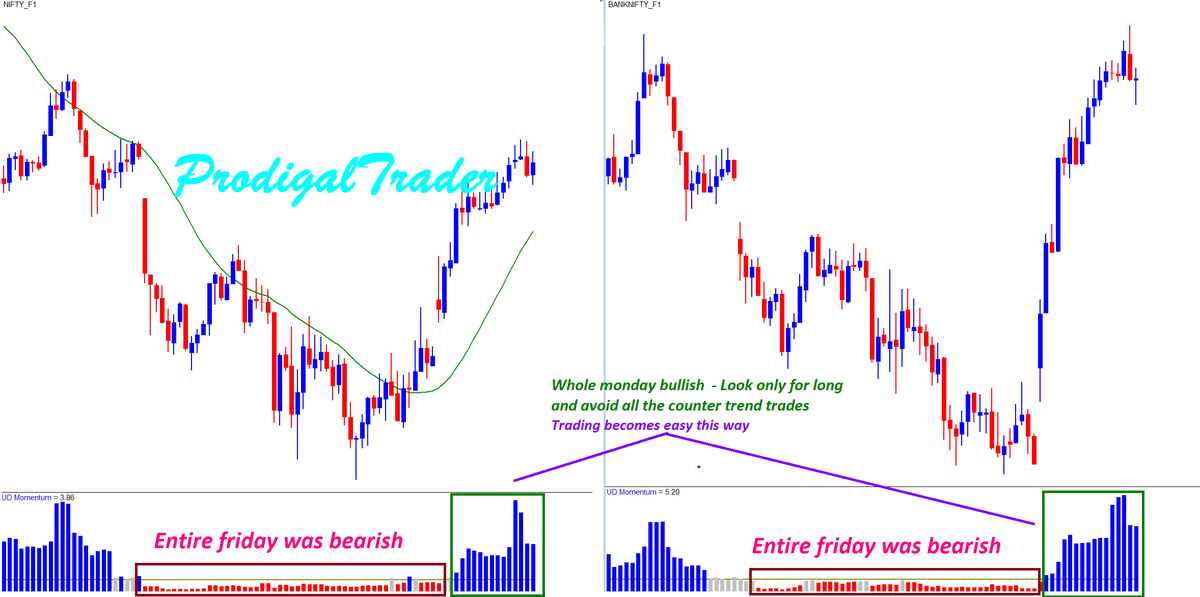
I have explained the importance of meeasuring momentum of the trend.
U can guage the strength in the trend once u know how to measure the direction.
This trend strength is infact signals the trend continuity or the potetnial for sustanining the trend.
Thats great assurace to hav https://t.co/HanLvlXkjQ
U can guage the strength in the trend once u know how to measure the direction.
This trend strength is infact signals the trend continuity or the potetnial for sustanining the trend.
Thats great assurace to hav https://t.co/HanLvlXkjQ
Before making ur trade entry or even before making a bias of trend as either bullish or bearish, do u use any objective measures to define the trend based on price, volume and momentum?
— Aneesh Philomina Antony (@ProdigalTrader) May 15, 2021
Price will always go back and forth move no matter how strong the trend is.
1/4 pic.twitter.com/qqizh2JO3J