
Long term bet & buy on dips candidate::
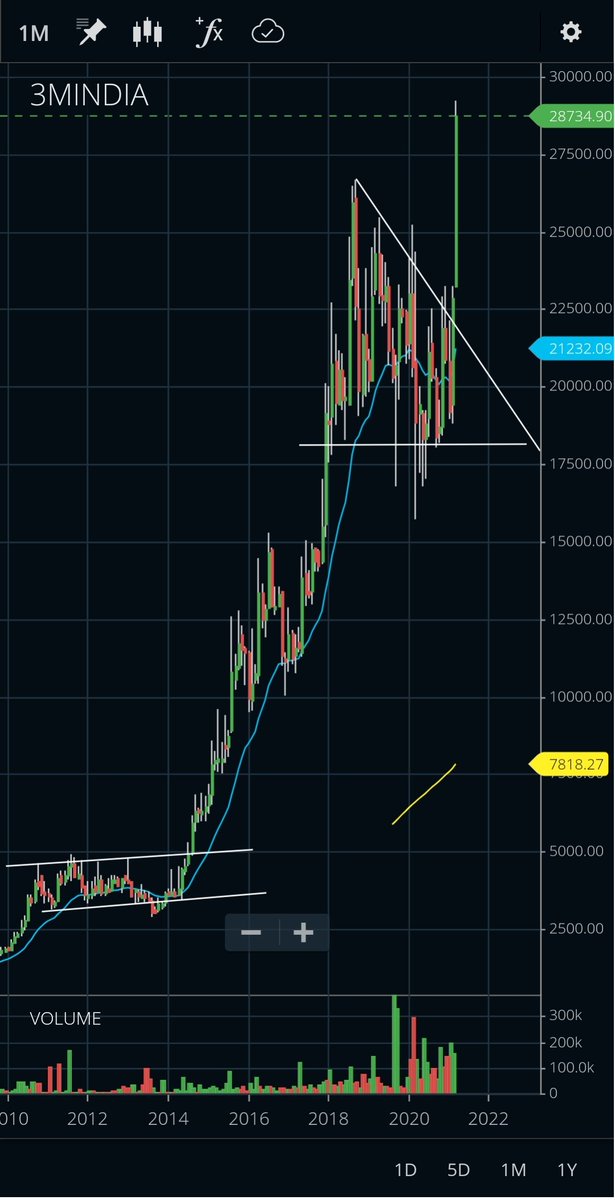
#3M india
gave monthly breakout after consolidating for 2.5 yrs approx.
Target atleast double within next 2 years.
More from Stocklearnings

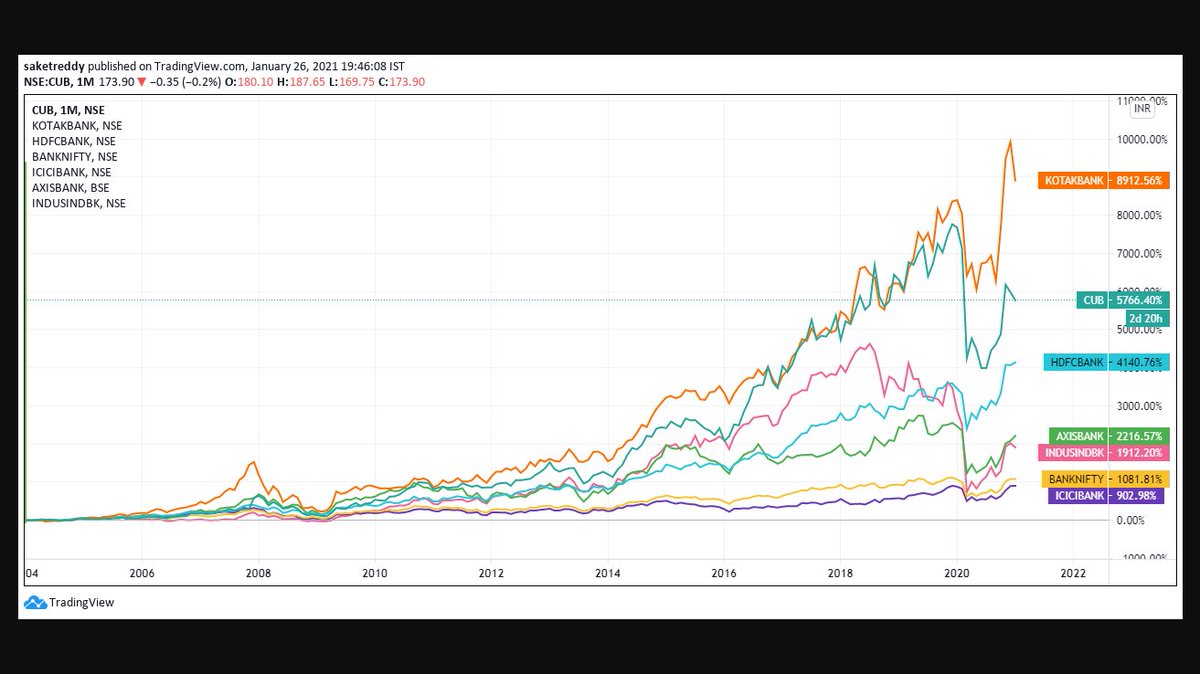
While people were debating figuring out which is the best in ICICI/AXIS & INDUSINDBNK, look what the top 3 high quality banks (HDFCBANK, KOTAKBANK & CUB) have done over the last 5, 10 & 17 years.
They are the real compounders, they've created massive wealth compared to others! https://t.co/PluVwU5OXG
They are the real compounders, they've created massive wealth compared to others! https://t.co/PluVwU5OXG
Hope Everyone saw BANDHANBNK Numbers. I feel many such banks will go through a massive NPA Cycle followed by depleted Tier 1.
— Saket Reddy (@saketreddy) January 24, 2021
Hence, stay with the Top 3 banks :-
HDFCBANK
KOTAKBANK
CUB
They've low cost of funding, well provisioned Moratorium book, high ROEs & high Tier 1 CAR.

25k webinar Done in a tweet
A sweet and simple BNF Setup i use
Alligator Setup
Retweet so that everyone can get benefited.
Check Full thread for full strategy.
1. You have to use 2 charts simultaneously , first chart of bank nifty spot 15 min time frame , candle used heikin ashi
Second chart 15 min bnf future normal candle.
2. Indicator used is alligator , in the indicator you have to only use the jaw of indicator.
3. Whenever spot and future candle closes simultaneously below the jaw line , short at the low of the candle which closed below the jawline.
4. Whenever spot and future candle closes simultaneously above the jaw line , buy at the high of the candle which closes above the jawline.
5. Target and Stoploss - Ideal target which i personally take is 100 points.
Stoploss also 100 points.
On trending days you can trail and take 200/300/400 points also.
I have personally made maximum 624 points in bank nifty in a single trade.
6. Precautions - never trade on sideways days.
7. Never trade on gap up or gapdown of more than 100 points .
I have made a detailed video on the same.
Link https://t.co/XMolGUKZPF
Thankyou for reading.
A sweet and simple BNF Setup i use
Alligator Setup
Retweet so that everyone can get benefited.
Check Full thread for full strategy.
1. You have to use 2 charts simultaneously , first chart of bank nifty spot 15 min time frame , candle used heikin ashi
Second chart 15 min bnf future normal candle.
2. Indicator used is alligator , in the indicator you have to only use the jaw of indicator.
3. Whenever spot and future candle closes simultaneously below the jaw line , short at the low of the candle which closed below the jawline.
4. Whenever spot and future candle closes simultaneously above the jaw line , buy at the high of the candle which closes above the jawline.
5. Target and Stoploss - Ideal target which i personally take is 100 points.
Stoploss also 100 points.
On trending days you can trail and take 200/300/400 points also.
I have personally made maximum 624 points in bank nifty in a single trade.
6. Precautions - never trade on sideways days.
7. Never trade on gap up or gapdown of more than 100 points .
I have made a detailed video on the same.
Link https://t.co/XMolGUKZPF
Thankyou for reading.



DJ @ITRADE191 multiple chart analysis for INTRADAY TRADING.
1. Core setup
2. Pivot points trades
3. PDH/PDL trades
4. Open interest addictions combined with rejections on charts.
5. Website to confirm bias
Very quick read.
Share if you liked for the benefit of everyone.
•Main setup of @ITRADE191
He used this setup daily for all trades.
1. EMA crossover 10/20
2. Supertrend 10/3
3. Vwap
4. RSI >
•Volume always greater than
•Candle Rejecting from
•Pivot settings
1. Core setup
2. Pivot points trades
3. PDH/PDL trades
4. Open interest addictions combined with rejections on charts.
5. Website to confirm bias
Very quick read.
Share if you liked for the benefit of everyone.
•Main setup of @ITRADE191
He used this setup daily for all trades.
1. EMA crossover 10/20
2. Supertrend 10/3
3. Vwap
4. RSI >
@MiteshFan @Mitesh_Engr @Abhishekkar_ MY TRADING SETUP .... I've been using it for a long time .. result good try it \U0001f607 pic.twitter.com/XThUD0ftbl
— itrade(DJ) (@ITRADE191) June 13, 2020
•Volume always greater than
Volume Should always be above 20 pic.twitter.com/CPgxLgpPKF
— itrade(DJ) (@ITRADE191) June 13, 2020
•Candle Rejecting from
— itrade(DJ) (@ITRADE191) August 25, 2020
•Pivot settings
— itrade(DJ) (@ITRADE191) October 20, 2020
You May Also Like


1/OK, data mystery time.
This New York Times feature shows China with a Gini Index of less than 30, which would make it more equal than Canada, France, or the Netherlands. https://t.co/g3Sv6DZTDE
That's weird. Income inequality in China is legendary.
Let's check this number.
2/The New York Times cites the World Bank's recent report, "Fair Progress? Economic Mobility across Generations Around the World".
The report is available here:
3/The World Bank report has a graph in which it appears to show the same value for China's Gini - under 0.3.
The graph cites the World Development Indicators as its source for the income inequality data.

4/The World Development Indicators are available at the World Bank's website.
Here's the Gini index: https://t.co/MvylQzpX6A
It looks as if the latest estimate for China's Gini is 42.2.
That estimate is from 2012.
5/A Gini of 42.2 would put China in the same neighborhood as the U.S., whose Gini was estimated at 41 in 2013.
I can't find the <30 number anywhere. The only other estimate in the tables for China is from 2008, when it was estimated at 42.8.
This New York Times feature shows China with a Gini Index of less than 30, which would make it more equal than Canada, France, or the Netherlands. https://t.co/g3Sv6DZTDE
That's weird. Income inequality in China is legendary.
Let's check this number.
2/The New York Times cites the World Bank's recent report, "Fair Progress? Economic Mobility across Generations Around the World".
The report is available here:
3/The World Bank report has a graph in which it appears to show the same value for China's Gini - under 0.3.
The graph cites the World Development Indicators as its source for the income inequality data.
4/The World Development Indicators are available at the World Bank's website.
Here's the Gini index: https://t.co/MvylQzpX6A
It looks as if the latest estimate for China's Gini is 42.2.
That estimate is from 2012.
5/A Gini of 42.2 would put China in the same neighborhood as the U.S., whose Gini was estimated at 41 in 2013.
I can't find the <30 number anywhere. The only other estimate in the tables for China is from 2008, when it was estimated at 42.8.











1/OK, data mystery time.
This New York Times feature shows China with a Gini Index of less than 30, which would make it more equal than Canada, France, or the Netherlands. https://t.co/g3Sv6DZTDE
That's weird. Income inequality in China is legendary.
Let's check this number.
2/The New York Times cites the World Bank's recent report, "Fair Progress? Economic Mobility across Generations Around the World".
The report is available here:
3/The World Bank report has a graph in which it appears to show the same value for China's Gini - under 0.3.
The graph cites the World Development Indicators as its source for the income inequality data.
4/The World Development Indicators are available at the World Bank's website.
Here's the Gini index: https://t.co/MvylQzpX6A
It looks as if the latest estimate for China's Gini is 42.2.
That estimate is from 2012.
5/A Gini of 42.2 would put China in the same neighborhood as the U.S., whose Gini was estimated at 41 in 2013.
I can't find the <30 number anywhere. The only other estimate in the tables for China is from 2008, when it was estimated at 42.8.
This New York Times feature shows China with a Gini Index of less than 30, which would make it more equal than Canada, France, or the Netherlands. https://t.co/g3Sv6DZTDE
That's weird. Income inequality in China is legendary.
Let's check this number.
2/The New York Times cites the World Bank's recent report, "Fair Progress? Economic Mobility across Generations Around the World".
The report is available here:
3/The World Bank report has a graph in which it appears to show the same value for China's Gini - under 0.3.
The graph cites the World Development Indicators as its source for the income inequality data.
4/The World Development Indicators are available at the World Bank's website.
Here's the Gini index: https://t.co/MvylQzpX6A
It looks as if the latest estimate for China's Gini is 42.2.
That estimate is from 2012.
5/A Gini of 42.2 would put China in the same neighborhood as the U.S., whose Gini was estimated at 41 in 2013.
I can't find the <30 number anywhere. The only other estimate in the tables for China is from 2008, when it was estimated at 42.8.