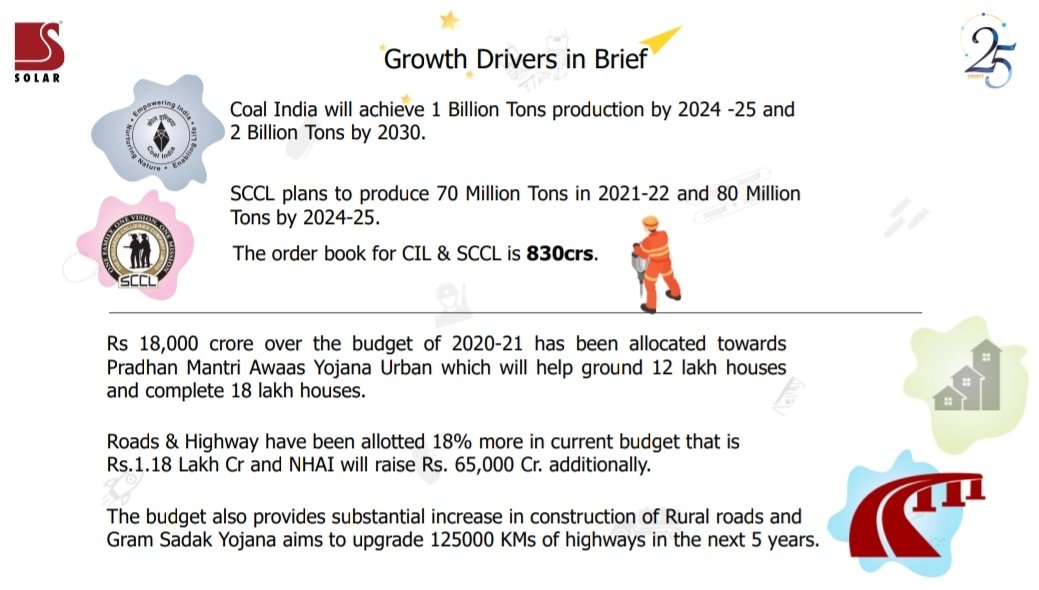
The ultimate proxy for Infra, Coal India, mining & defence, SOLARINDS is planning a significant expansion to increase its packaged explosives manufacturing capacity.
The co is guiding for a > 30% Topline & Bottomline growth in FY22, would huge if they can really walk the talk!
More from Saket Reddy
SAREGAMA
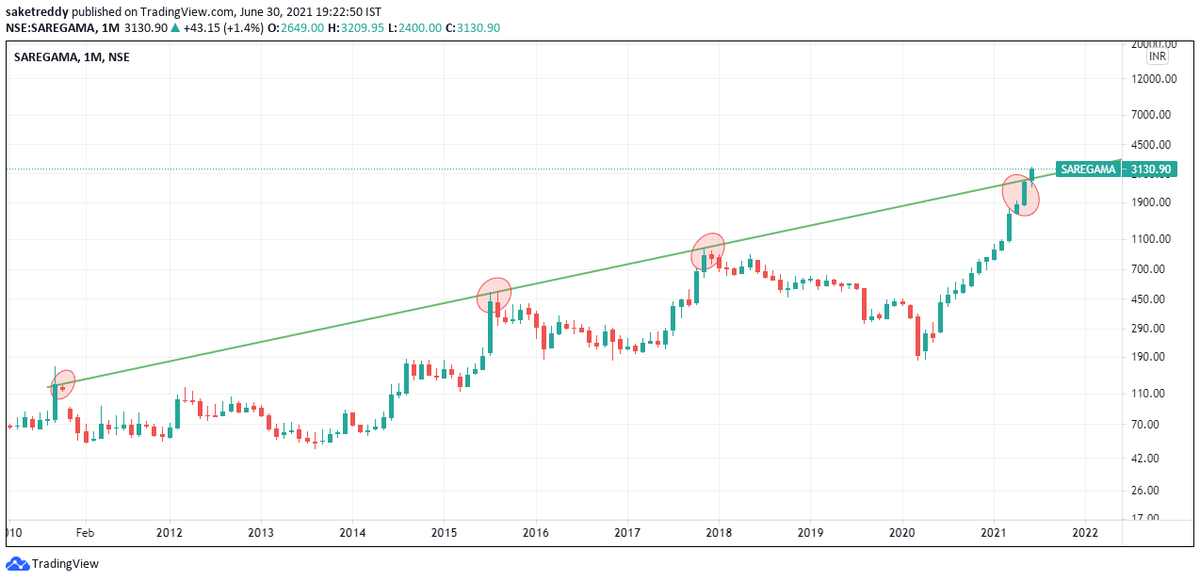
Today's closing is a monthly close and this is done & dusted, we now have a solid monthly close above the 10 year supply zone.
If the stock has broken out from a 10 year supply zone & a 20 year peak, surely something would've changed!
Do study the industry structure! https://t.co/zA3qztFzon
Today's closing is a monthly close and this is done & dusted, we now have a solid monthly close above the 10 year supply zone.
If the stock has broken out from a 10 year supply zone & a 20 year peak, surely something would've changed!
Do study the industry structure! https://t.co/zA3qztFzon
SAREGAMA at a very important juncture now on the monthly chart considering today's close is also a monthly close.
— Saket Reddy (@saketreddy) May 31, 2021
Nearing a breakout from over a 10 year supply zone! https://t.co/qpsSn3obrE pic.twitter.com/1xTmB6WvhK
LAURUSLABS
Haters are still hating it, time to pyramid once again!
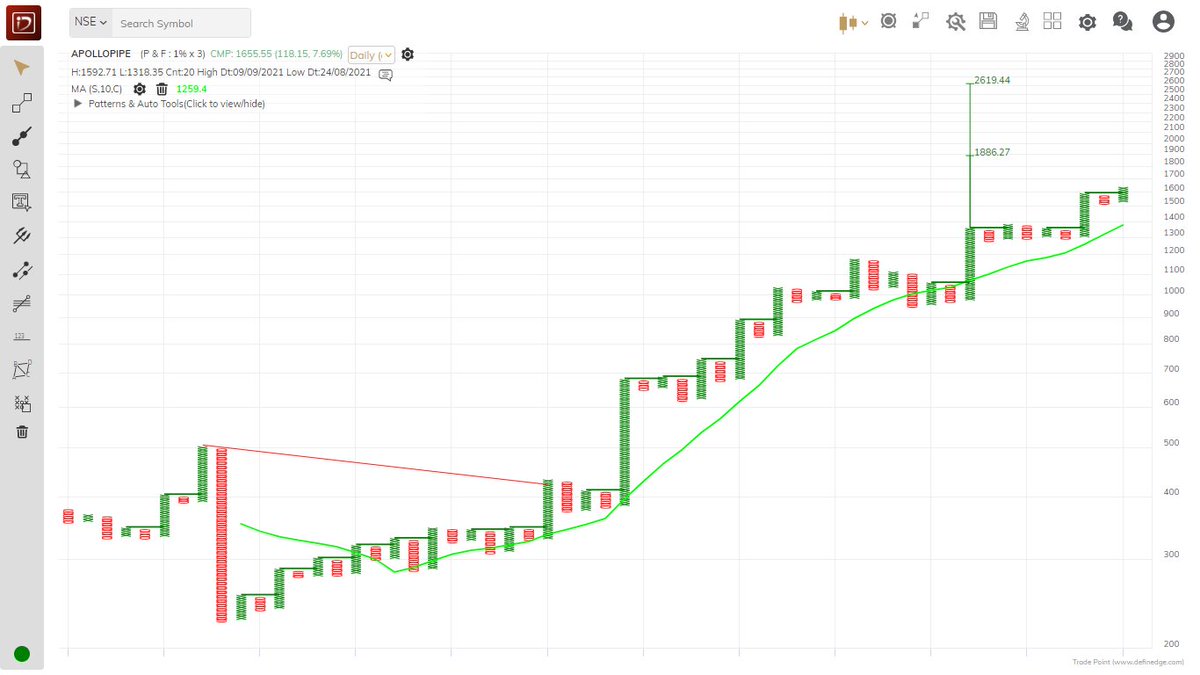
Double Top Buy, T20 Pattern - Bullish & Super Pattern - Bullish above 625.07 daily close on 1% Box Size chart. https://t.co/EDqa7dAAKn
Haters are still hating it, time to pyramid once again!
Double Top Buy, T20 Pattern - Bullish & Super Pattern - Bullish above 625.07 daily close on 1% Box Size chart. https://t.co/EDqa7dAAKn
LAURUSLABS
— Saket Reddy (@saketreddy) May 3, 2021
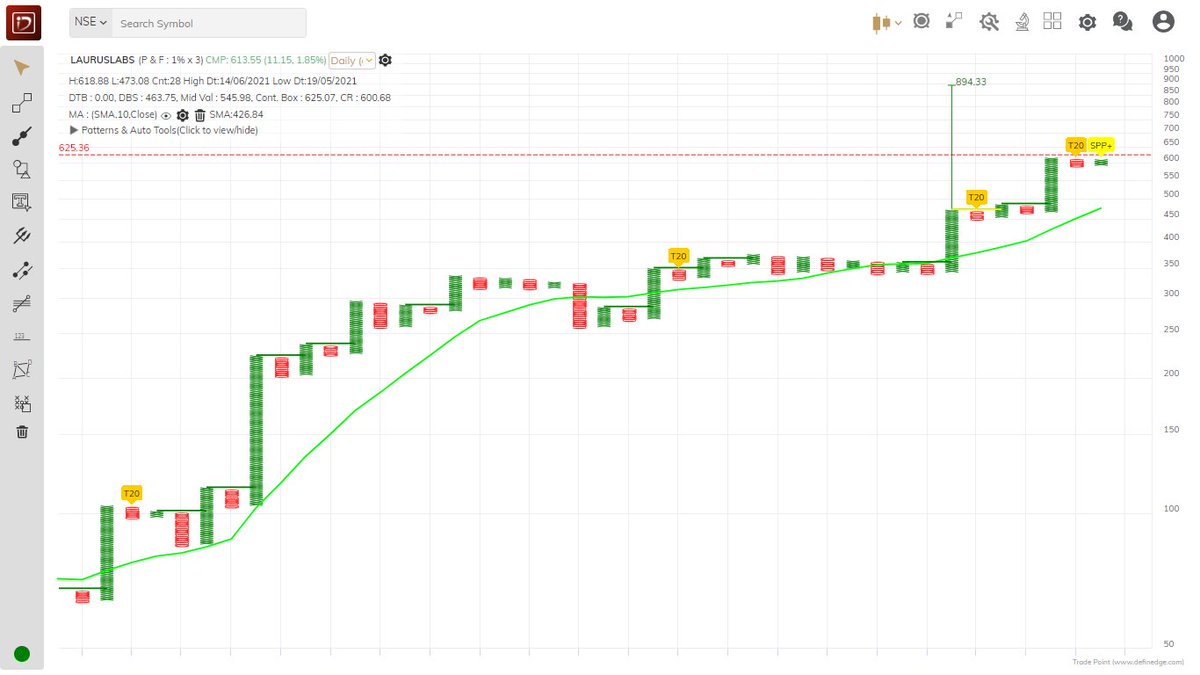
Haters are gonna hate, but IMO, this is the best opportunity to start pyramiding and make it a well sized holding.
A trio of patterns coming together, has one of the highest success rate!
Double Top Buy, T20 Pattern - Bullish & Super pattern - Bullish above 477.81! https://t.co/SqzkTyb9wx pic.twitter.com/hTj7mfAOqy
KPRMILL
Double Top Buy triggered above 459.17 (2295 Pre Split) daily close on 1% Box Size chart. https://t.co/0jUBx6hKMI
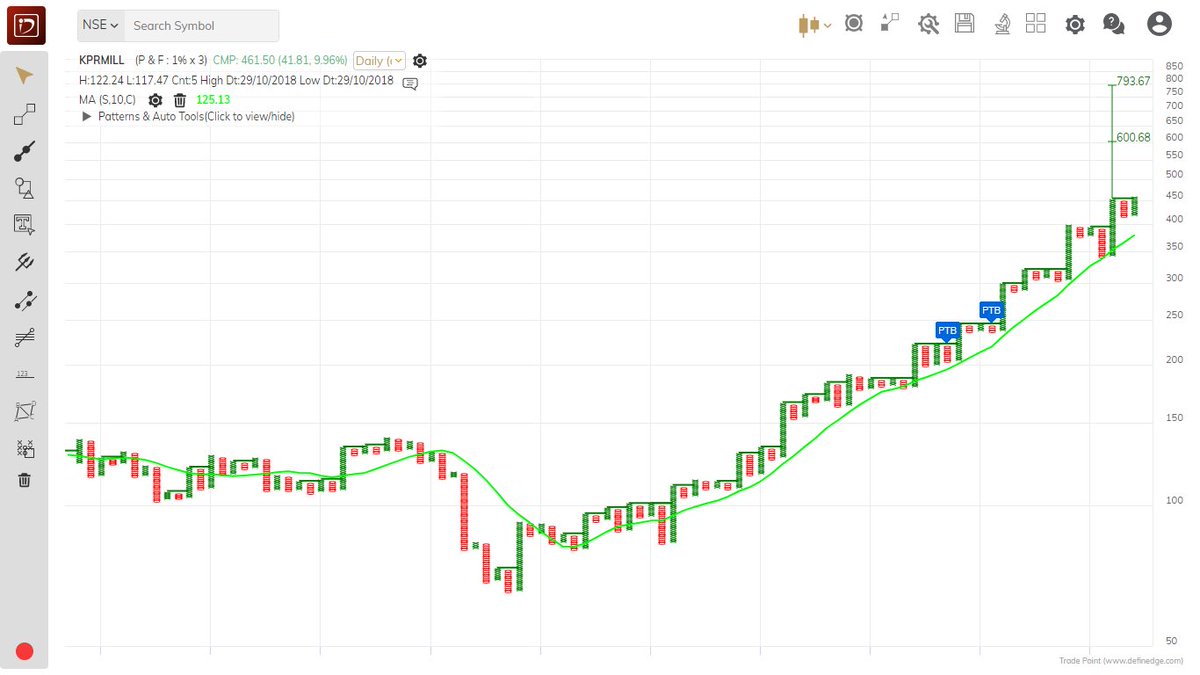
Double Top Buy triggered above 459.17 (2295 Pre Split) daily close on 1% Box Size chart. https://t.co/0jUBx6hKMI
KPRMILL
— Saket Reddy (@saketreddy) September 3, 2021
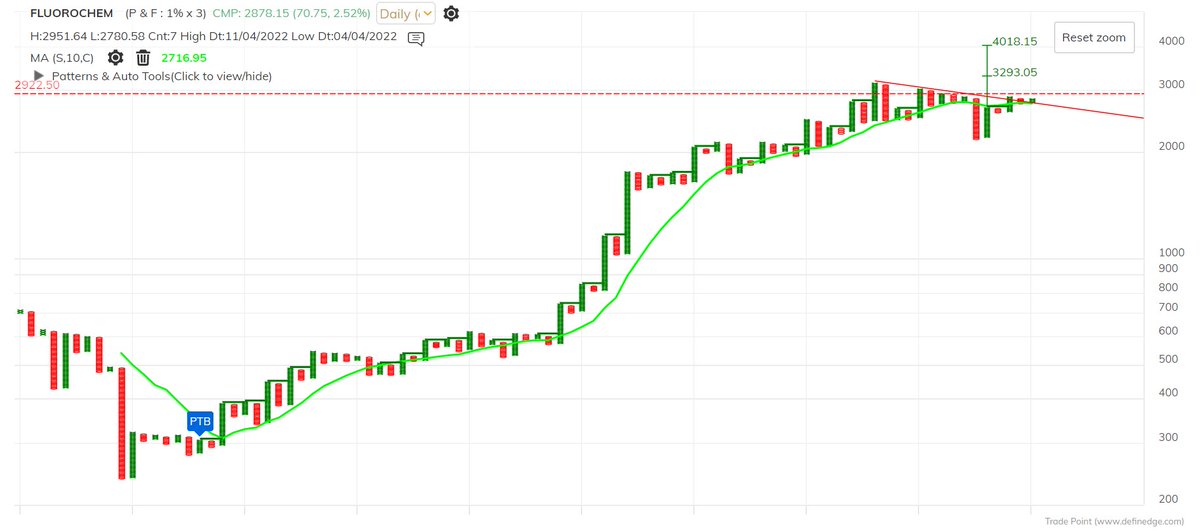
Double Top Buy & T20 Pattern - Bullish above 2051.18 daily close on 3% Box Size chart. https://t.co/bJgLA1BGuv pic.twitter.com/xpTKy6vnBT
You May Also Like

1/OK, data mystery time.
This New York Times feature shows China with a Gini Index of less than 30, which would make it more equal than Canada, France, or the Netherlands. https://t.co/g3Sv6DZTDE
That's weird. Income inequality in China is legendary.
Let's check this number.
2/The New York Times cites the World Bank's recent report, "Fair Progress? Economic Mobility across Generations Around the World".
The report is available here:
3/The World Bank report has a graph in which it appears to show the same value for China's Gini - under 0.3.
The graph cites the World Development Indicators as its source for the income inequality data.

4/The World Development Indicators are available at the World Bank's website.
Here's the Gini index: https://t.co/MvylQzpX6A
It looks as if the latest estimate for China's Gini is 42.2.
That estimate is from 2012.
5/A Gini of 42.2 would put China in the same neighborhood as the U.S., whose Gini was estimated at 41 in 2013.
I can't find the <30 number anywhere. The only other estimate in the tables for China is from 2008, when it was estimated at 42.8.
This New York Times feature shows China with a Gini Index of less than 30, which would make it more equal than Canada, France, or the Netherlands. https://t.co/g3Sv6DZTDE
That's weird. Income inequality in China is legendary.
Let's check this number.
2/The New York Times cites the World Bank's recent report, "Fair Progress? Economic Mobility across Generations Around the World".
The report is available here:
3/The World Bank report has a graph in which it appears to show the same value for China's Gini - under 0.3.
The graph cites the World Development Indicators as its source for the income inequality data.
4/The World Development Indicators are available at the World Bank's website.
Here's the Gini index: https://t.co/MvylQzpX6A
It looks as if the latest estimate for China's Gini is 42.2.
That estimate is from 2012.
5/A Gini of 42.2 would put China in the same neighborhood as the U.S., whose Gini was estimated at 41 in 2013.
I can't find the <30 number anywhere. The only other estimate in the tables for China is from 2008, when it was estimated at 42.8.