Saregama - once the buying force is turned OFF, no amount of +ve news will be able to lift that up. Selling volumes are too high for this counter. https://t.co/9gqhuokhTX

Saregama - you must analyze this chart for why it failed. A normal pullback is still OK but retracement on high volumes is not a healthy sign at all. that too with breaking below a key 50 MA. https://t.co/gKJQtbkaio pic.twitter.com/iG9FGc70ue
— The_Chartist \U0001f4c8 (@charts_zone) March 16, 2022
More from The_Chartist 📈

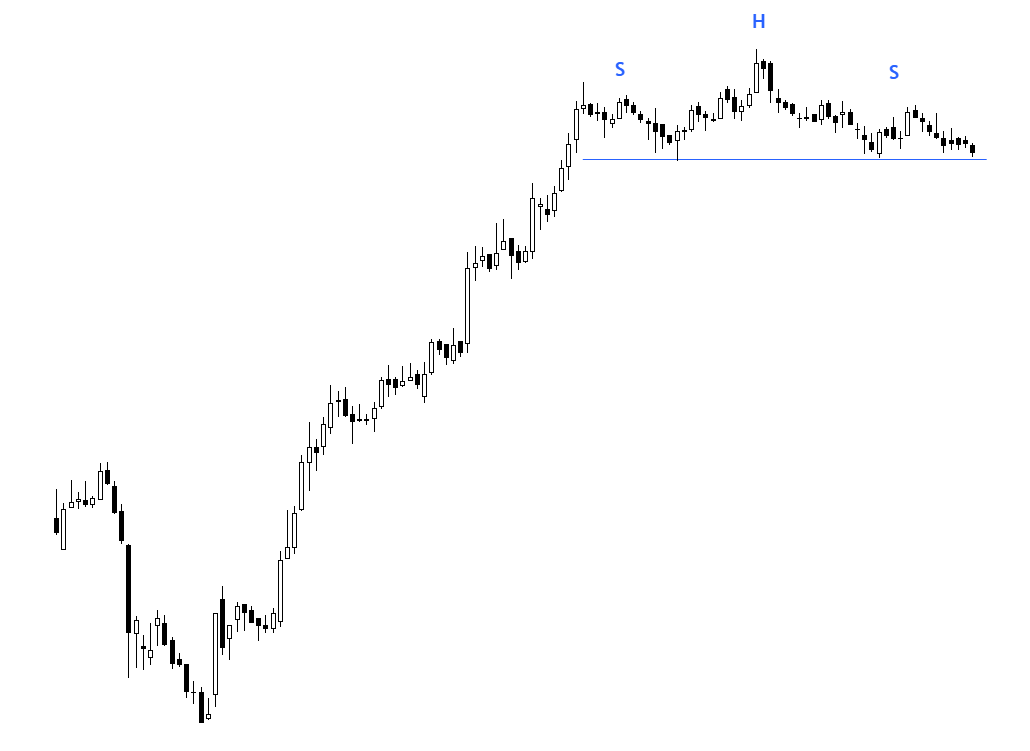
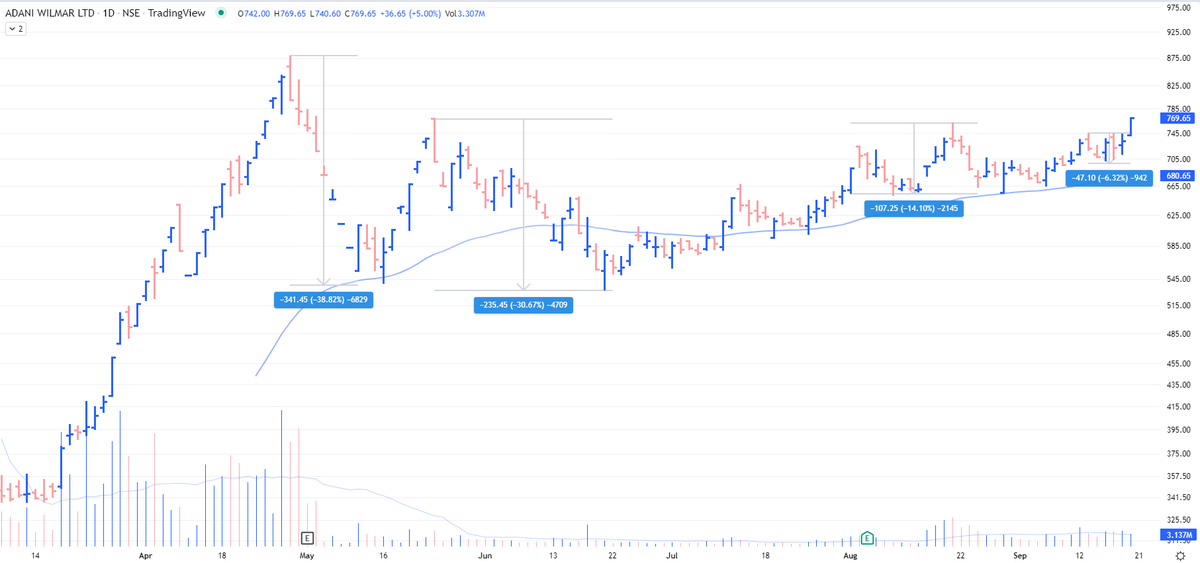
AWL - look at the ranges of contraction on the chart https://t.co/2XMhqZQu8X
Borosil Renewables - Patterns like these must be looked at carefully and must be kept on the radar. Herein price is contracting which generally signifies shifting of hands (from weak to strong). If you go wrong, the risk is limited in these. pic.twitter.com/iqyoeslZjy
— The_Chartist \U0001f4c8 (@charts_zone) July 12, 2021
More from Screeners


It's much more powerful than you think
9 things TradingView can do, you'll wish you knew yesterday: 🧵
Collaborated with @niki_poojary
1/ Free Multi Timeframe Analysis
Step 1. Download Vivaldi Browser
Step 2. Login to trading view
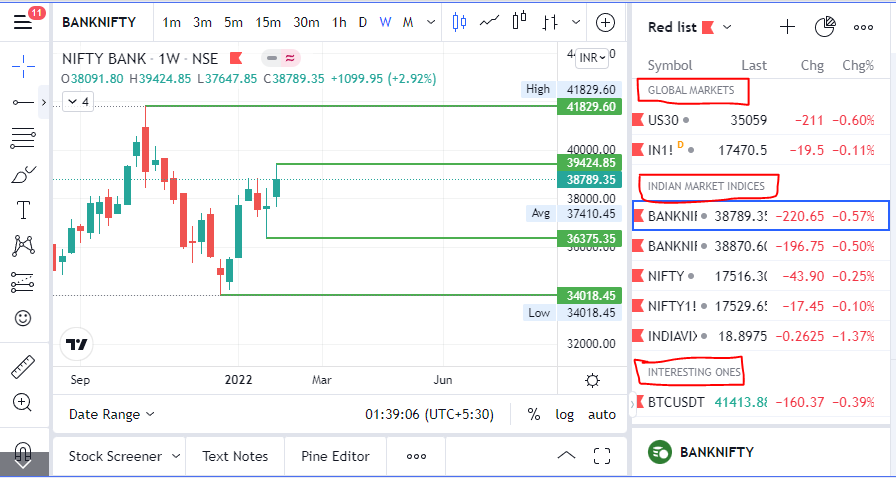
Step 3. Open bank nifty chart in 4 separate windows
Step 4. Click on the first tab and shift + click by mouse on the last tab.
Step 5. Select "Tile all 4 tabs"
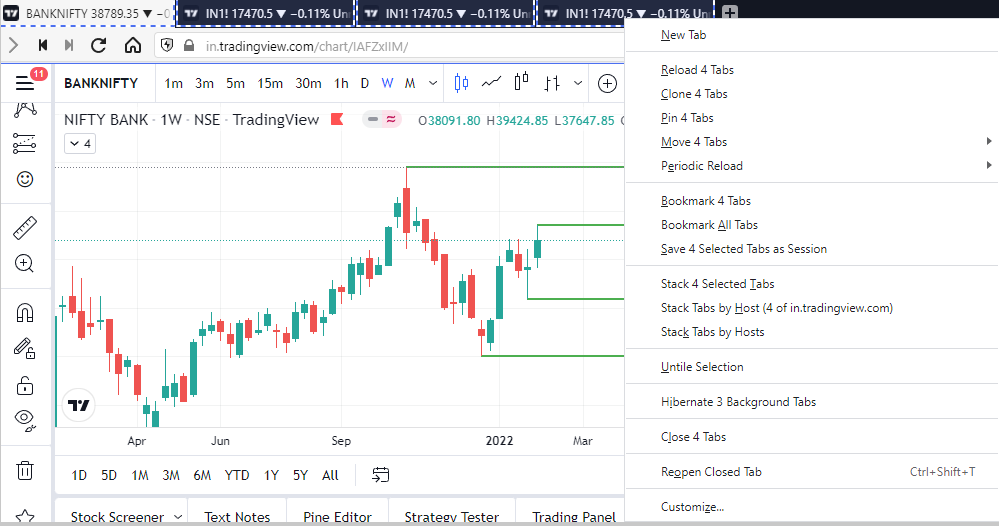
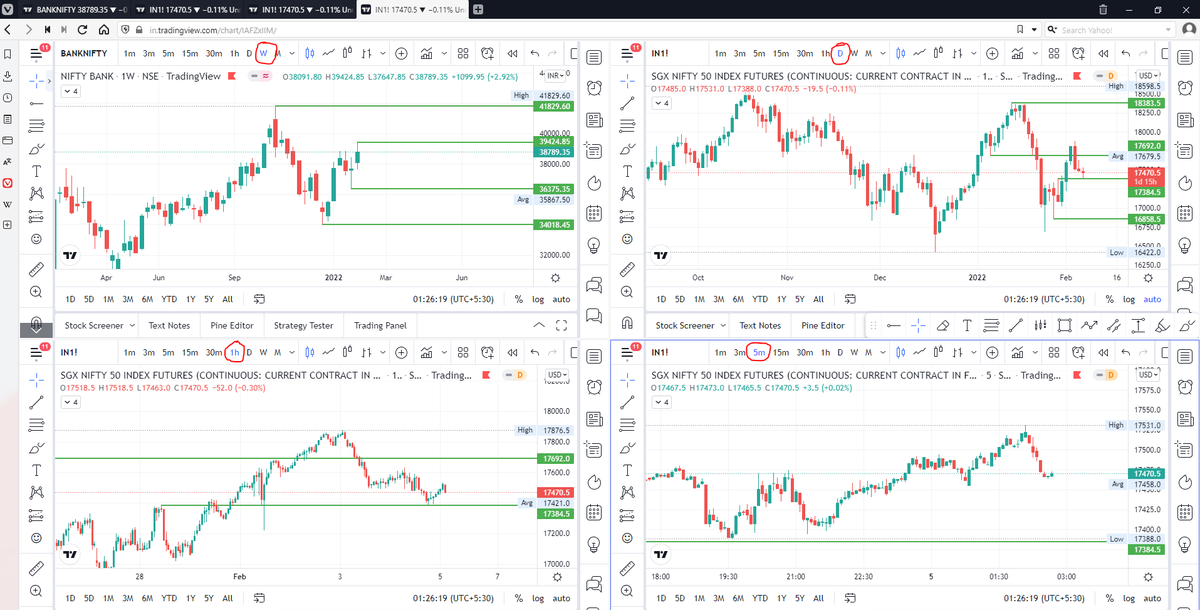
What happens is you get 4 charts joint on one screen.
Refer to the attached picture.
The best part about this is this is absolutely free to do.
Also, do note:
I do not have the paid version of trading view.
2/ Free Multiple Watchlists
Go through this informative thread where @sarosijghosh teaches you how to create multiple free watchlists in the free
\U0001d5e0\U0001d602\U0001d5f9\U0001d601\U0001d5f6\U0001d5fd\U0001d5f9\U0001d5f2 \U0001d600\U0001d5f2\U0001d5f0\U0001d601\U0001d5fc\U0001d5ff \U0001d604\U0001d5ee\U0001d601\U0001d5f0\U0001d5f5\U0001d5f9\U0001d5f6\U0001d600\U0001d601 \U0001d5fc\U0001d5fb \U0001d5e7\U0001d5ff\U0001d5ee\U0001d5f1\U0001d5f6\U0001d5fb\U0001d5f4\U0001d603\U0001d5f6\U0001d5f2\U0001d604 \U0001d602\U0001d600\U0001d5f6\U0001d5fb\U0001d5f4 \U0001d601\U0001d5f5\U0001d5f2 \U0001d5d9\U0001d5e5\U0001d5d8\U0001d5d8 \U0001d603\U0001d5f2\U0001d5ff\U0001d600\U0001d5f6\U0001d5fc\U0001d5fb!
— Sarosij Ghosh (@sarosijghosh) September 18, 2021
A THREAD \U0001f9f5
Please Like and Re-Tweet. It took a lot of effort to put this together. #StockMarket #TradingView #trading #watchlist #Nifty500 #stockstowatch
3/ Free Segregation into different headers/sectors
You can create multiple sections sector-wise for free.
1. Long tap on any index/stock and click on "Add section above."
2. Secgregate the stocks/indices based on where they belong.
Kinda like how I did in the picture below.

BTW Nifty Metal has inverse correlation with USDINR. https://t.co/X6cqVcYF3V
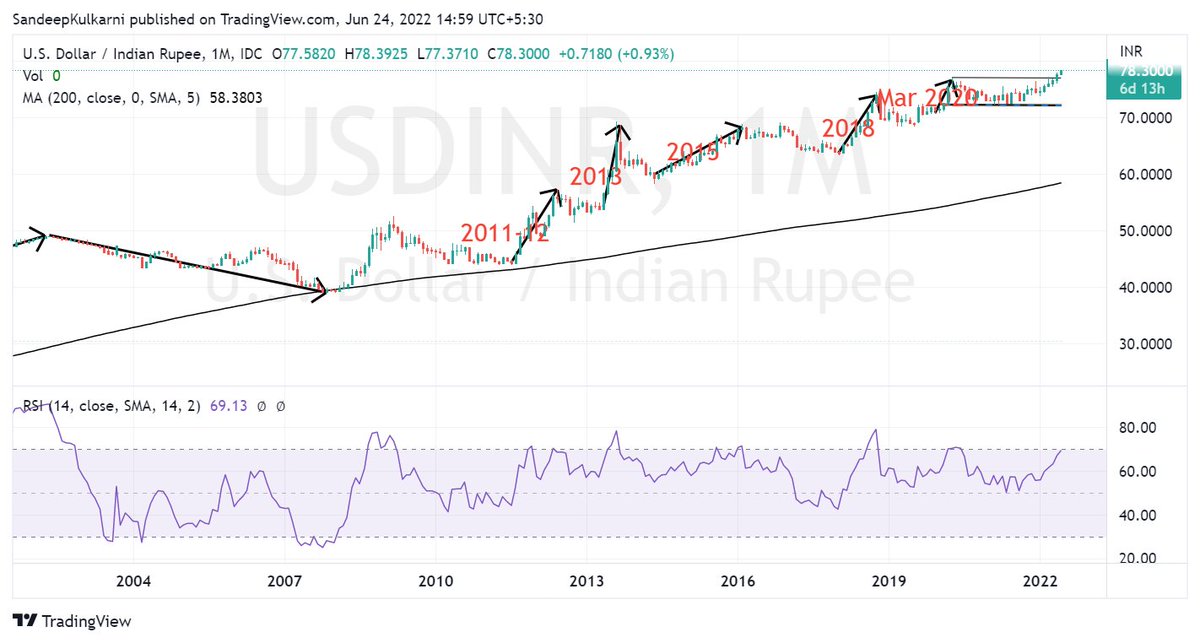
We know how our stock market has weathered the FII selling.
— Sandeep Kulkarni (@moneyworks4u_fa) June 10, 2022
But the equally big story is how Rupee has weathered $50bn+ outflows since Oct 2021. Hats off to RBI Governor Das & his team for having the vision of building huge reserves in his tenure. pic.twitter.com/CVuF9dM361