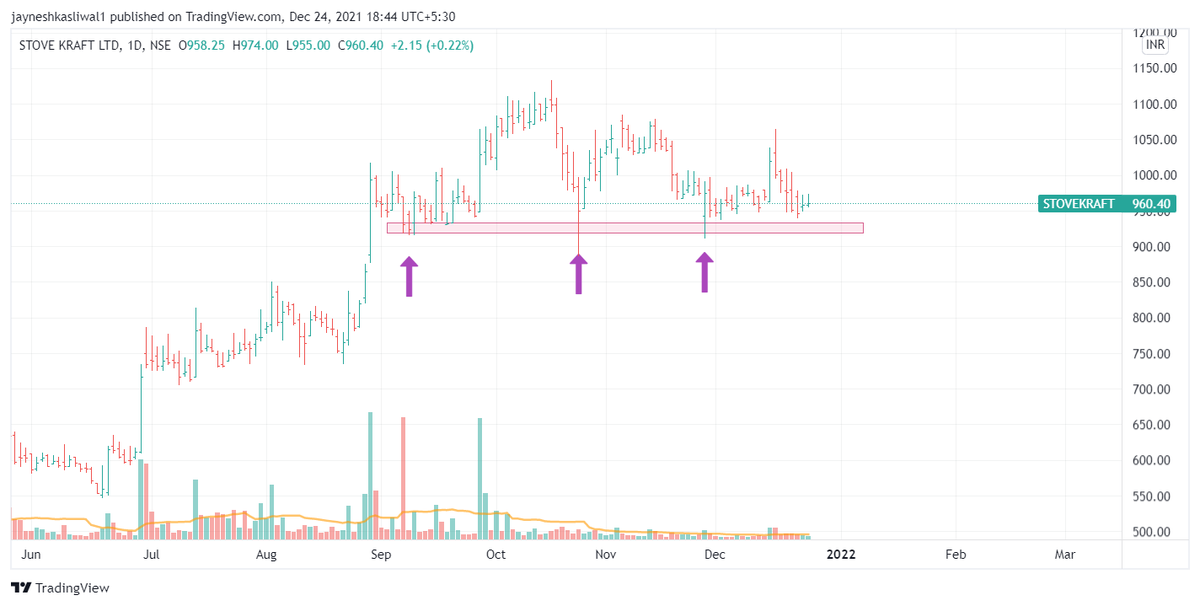
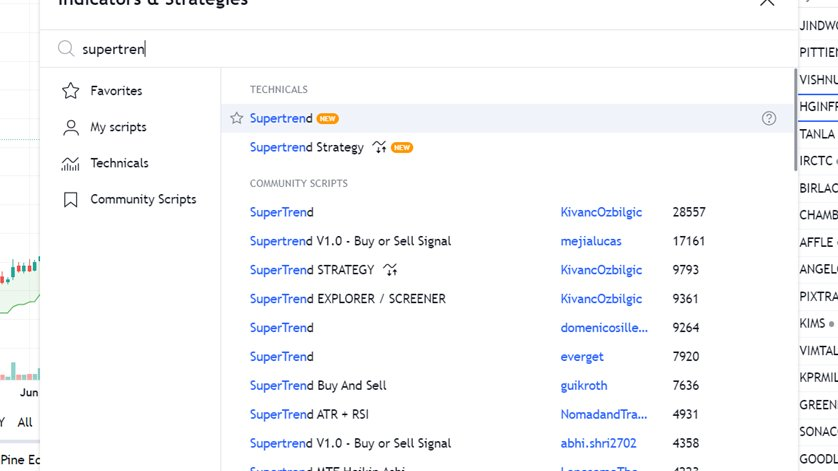
It is TrendFollowing Indicator That generates Buy / Sell signals based on the ATR value or volatility of the stock
Supertrend also works as a trailing stop-loss for the existing trades Best on daily time frame
2/n


How to Avoid Big Losses In trading ?
— JayneshKasliwal (@JayneshKasliwal) January 29, 2022
1. Avoid Stocks Below 200 ema
2. Sell Stocks in Stage 4 Down Trend
3. Dont Trade Stocks that are moving in Circuits
4. Avoid News based Trading
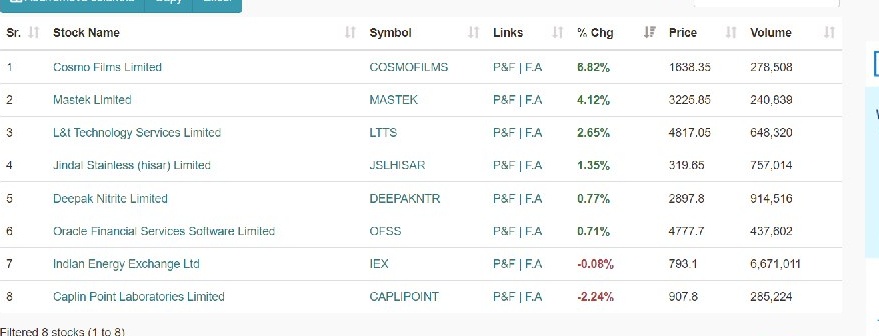
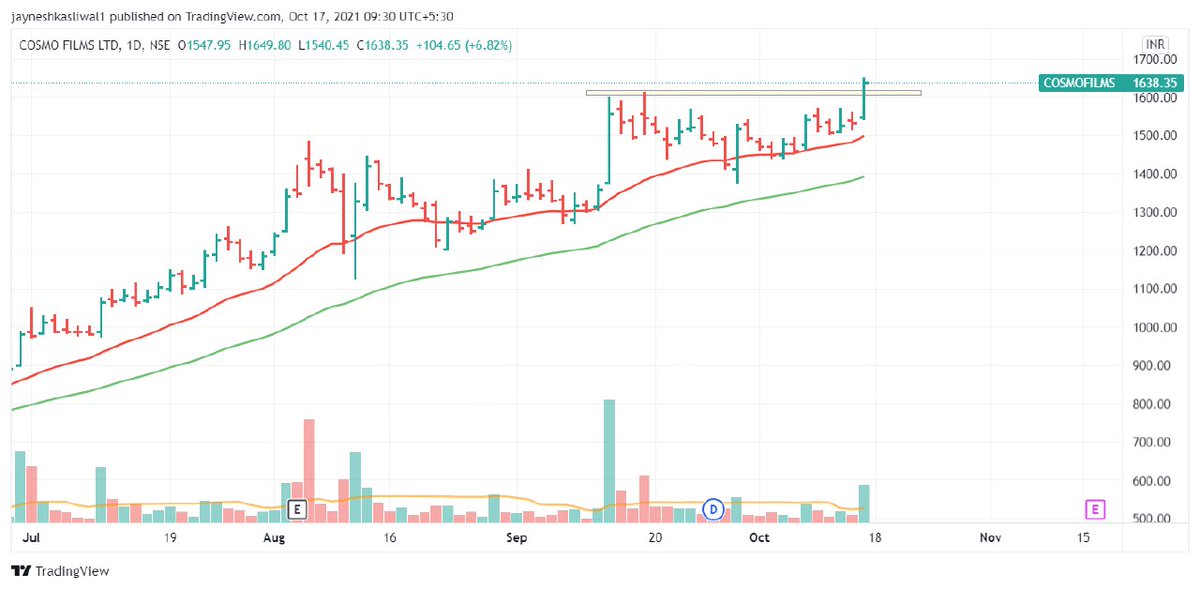
A thread With examples\U0001f516
Retweet to Educate Your Trading Friends !
1/n


\U0001d5e0\U0001d602\U0001d5f9\U0001d601\U0001d5f6\U0001d5fd\U0001d5f9\U0001d5f2 \U0001d600\U0001d5f2\U0001d5f0\U0001d601\U0001d5fc\U0001d5ff \U0001d604\U0001d5ee\U0001d601\U0001d5f0\U0001d5f5\U0001d5f9\U0001d5f6\U0001d600\U0001d601 \U0001d5fc\U0001d5fb \U0001d5e7\U0001d5ff\U0001d5ee\U0001d5f1\U0001d5f6\U0001d5fb\U0001d5f4\U0001d603\U0001d5f6\U0001d5f2\U0001d604 \U0001d602\U0001d600\U0001d5f6\U0001d5fb\U0001d5f4 \U0001d601\U0001d5f5\U0001d5f2 \U0001d5d9\U0001d5e5\U0001d5d8\U0001d5d8 \U0001d603\U0001d5f2\U0001d5ff\U0001d600\U0001d5f6\U0001d5fc\U0001d5fb!
— Sarosij Ghosh (@sarosijghosh) September 18, 2021
A THREAD \U0001f9f5
Please Like and Re-Tweet. It took a lot of effort to put this together. #StockMarket #TradingView #trading #watchlist #Nifty500 #stockstowatch
#CPR is an indicator which is used for #Intraday in Stock Market.
— Yash Mehta (@YMehta_) November 19, 2021
This learning thread would be on
"\U0001d650\U0001d668\U0001d65a\U0001d668 \U0001d664\U0001d65b \U0001d63e\U0001d64b\U0001d64d"
Like\u2764\ufe0f& Retweet\U0001f501for wider reach and for more such learning thread in the future.
Also, an investment strategy is shared using CPR in the end.
1/24
CPR indicator trend analysis:
— Gomathi Shankar (@cprbykgs) January 25, 2022
Candles below daily & weekly CPR \U0001f43b
Candles above daily CPR but below weekly CPR early confirmation of \U0001f402
Candles above daily + weekly CPR strong confirmation of \U0001f402
Isn\u2019t it simple?#cprbykgs #cprindicator #nifty #banknifty
#banknifty
— Gomathi Shankar (@cprbykgs) July 9, 2021
Candles above monthly CPR- Bullish
Candles above weekly CPR- Bullish
Now, whenever candles enter daily CPR range it indicates weakness of current trend & early signs of trend reversal.
So, wait for the candles to exit the daily CPR range then take the trade. (1/4) pic.twitter.com/7vaaLMCrV8
Rep. Andy Biggs and Rep. Matt Gaetz say DAG Rod Rosenstein cancelled an Oct. 11 appearance before the judiciary and oversight committees. They are now calling for a subpoena. pic.twitter.com/TknVHKjXtd
— Ivan Pentchoukov \U0001f1fa\U0001f1f8 (@IvanPentchoukov) October 10, 2018