Link - https://t.co/fIKlWSloNw
(1/4)
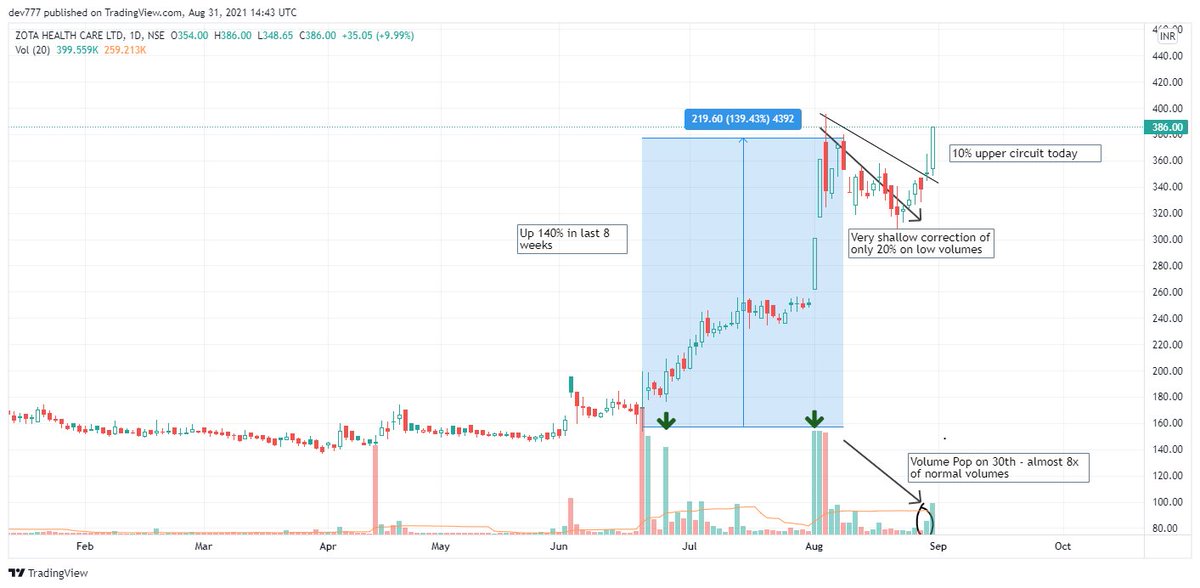
Only zota healthcare \U0001f680\U0001f680\U0001f680\U0001f40e
— EquiAlpha -MidTerm Momentum\U0001f40e\U0001f40e (@equialpha) August 31, 2021
Masterstroke \U0001f4a5\U0001f4a5\U0001f4a5 pic.twitter.com/hnH22mtUJN
HDFC bank Monthly Chart :
— EquiAlpha -MidTerm Momentum\U0001f40e\U0001f40e (@equialpha) March 7, 2022
In last 20 years - Only 2 times the stock has gone below 21 month EMA as market. This seems the third time (Monthly close will confirm )
Don't know but something seems off !!
Lets check again on month end pic.twitter.com/9eeVfikdnU
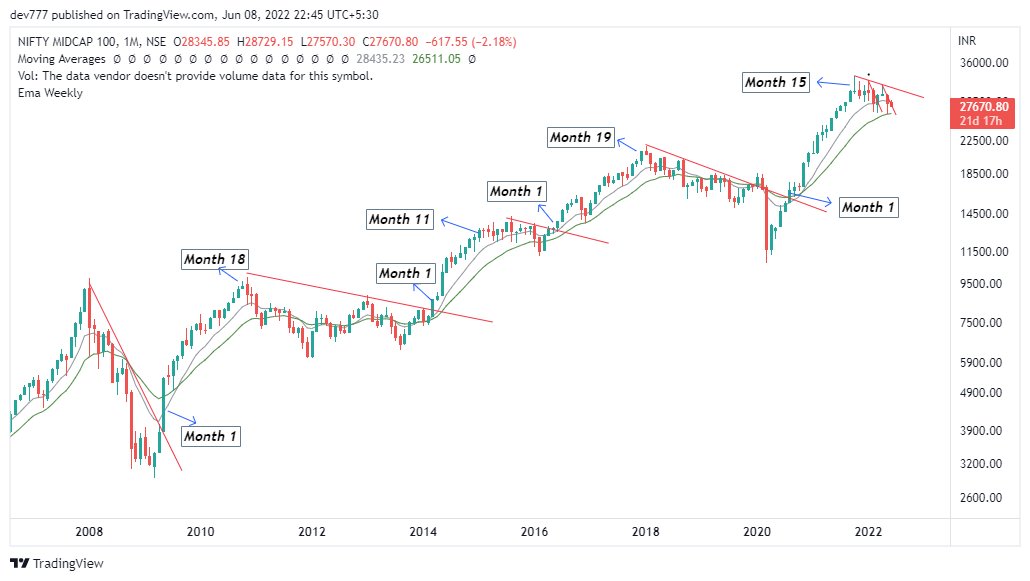
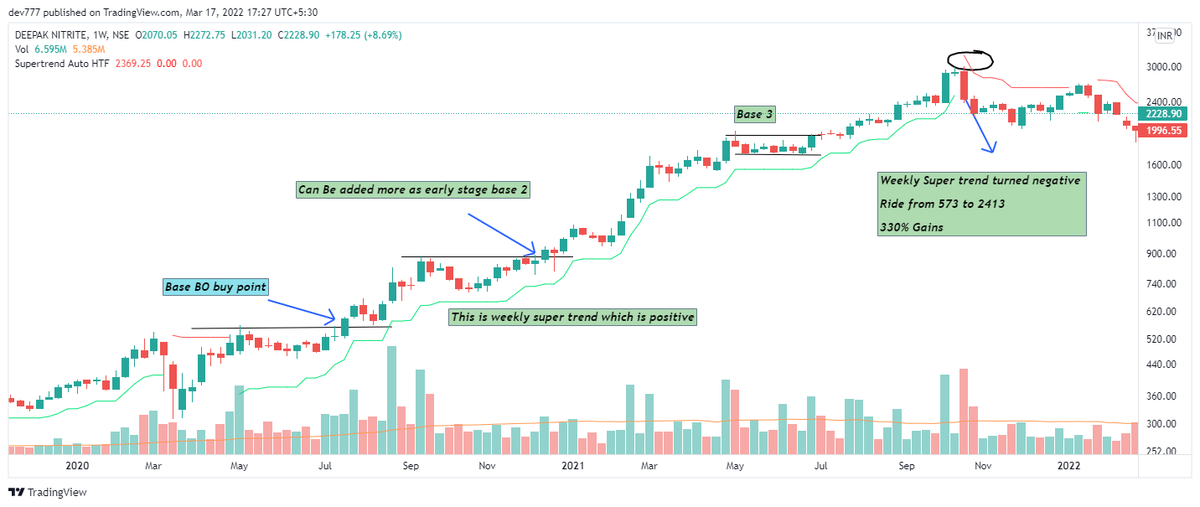
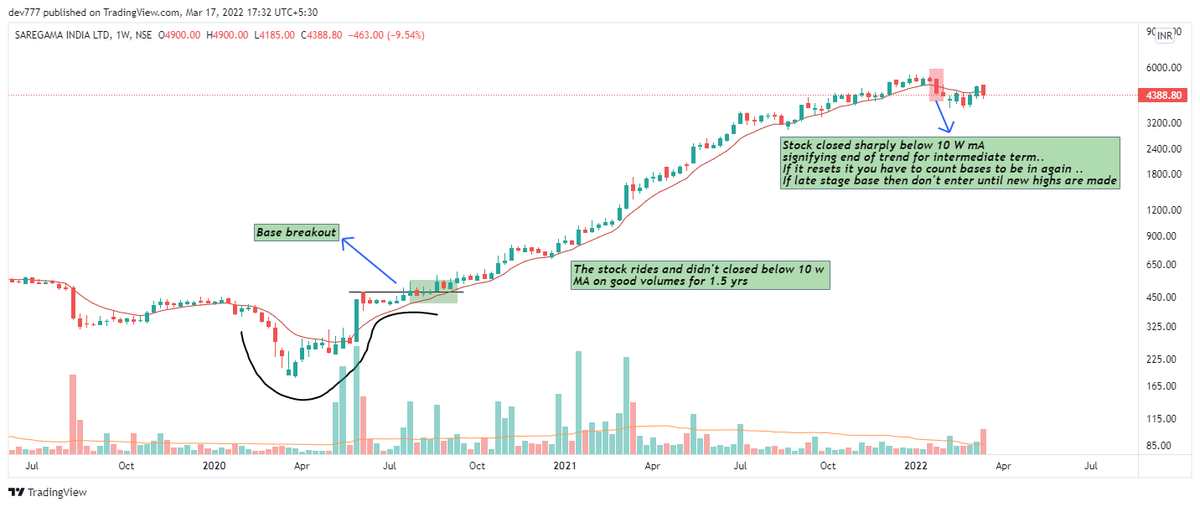
A backtesting of trends on monthly says - Good trends last 10-12 months on average after that they retest 20 EMA on monthly and sets up larger base
— EquiAlpha -MidTerm Momentum\U0001f40e\U0001f40e (@equialpha) June 8, 2022
You can use this to measure trends.. 3 examples for reference
1) FSl
2) Deepak NItrite
3) Balaji amines
4) Indiamart
(1/2) pic.twitter.com/FxUZmjPGNL