
SAREGAMA
Today's closing is a monthly close and this is done & dusted, we now have a solid monthly close above the 10 year supply zone.
If the stock has broken out from a 10 year supply zone & a 20 year peak, surely something would've changed!
Do study the industry structure! https://t.co/zA3qztFzon
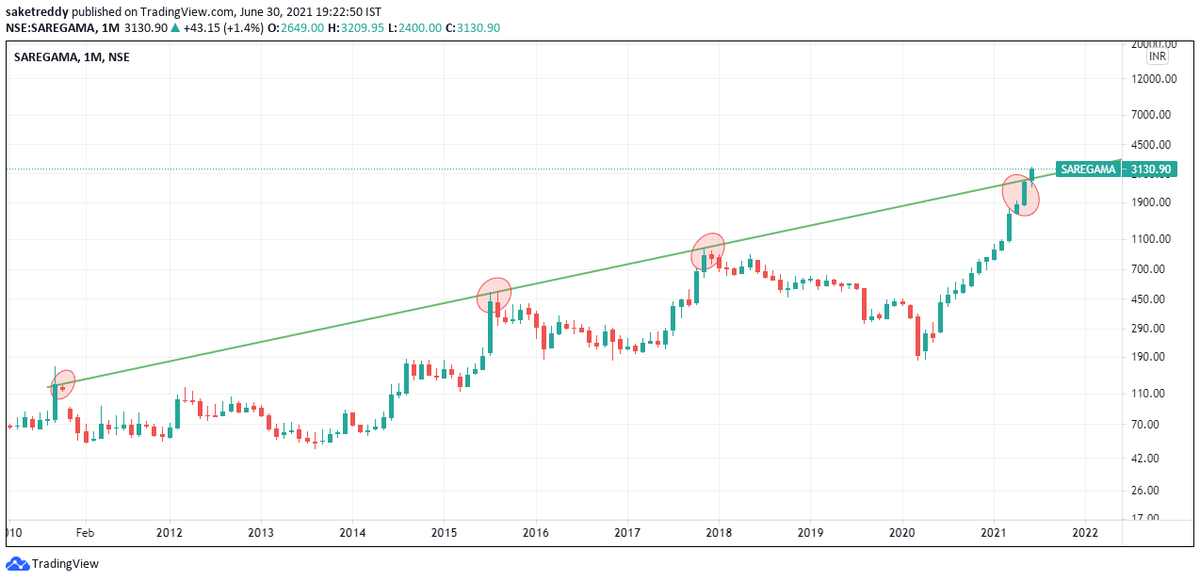
SAREGAMA at a very important juncture now on the monthly chart considering today's close is also a monthly close.
— Saket Reddy (@saketreddy) May 31, 2021
Nearing a breakout from over a 10 year supply zone! https://t.co/qpsSn3obrE pic.twitter.com/1xTmB6WvhK
More from Saket Reddy
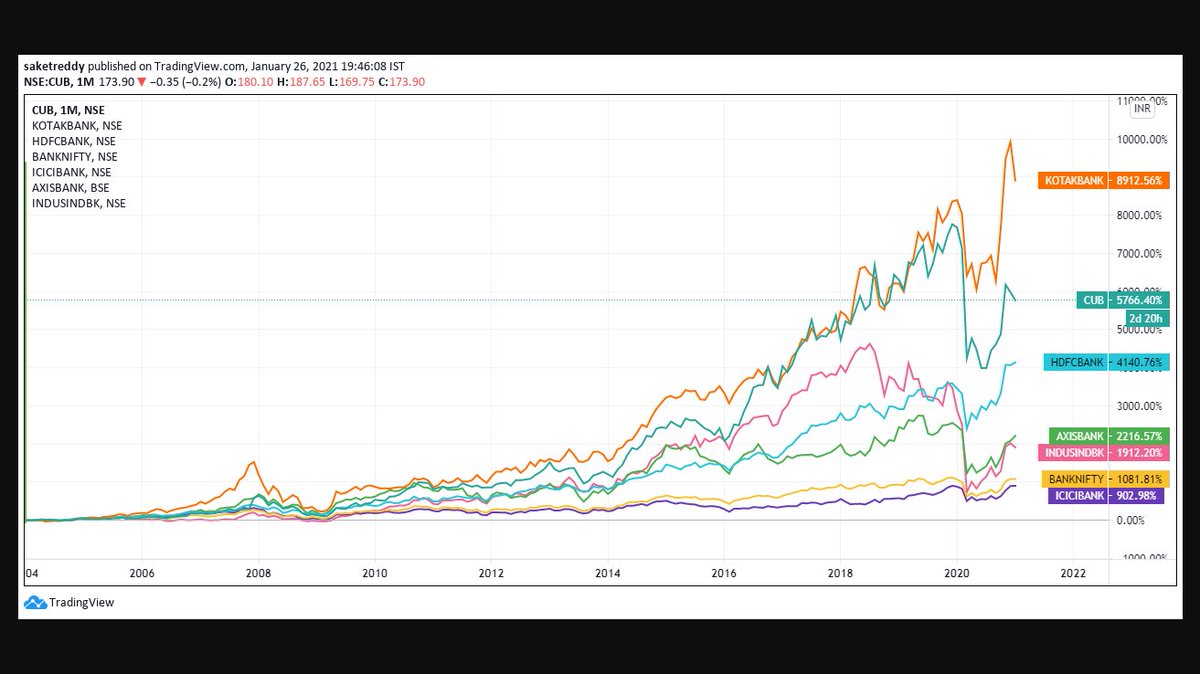
They are the real compounders, they've created massive wealth compared to others! https://t.co/PluVwU5OXG
Hope Everyone saw BANDHANBNK Numbers. I feel many such banks will go through a massive NPA Cycle followed by depleted Tier 1.
— Saket Reddy (@saketreddy) January 24, 2021
Hence, stay with the Top 3 banks :-
HDFCBANK
KOTAKBANK
CUB
They've low cost of funding, well provisioned Moratorium book, high ROEs & high Tier 1 CAR.
Haters are still hating it, time to pyramid once again!
Double Top Buy, T20 Pattern - Bullish & Super Pattern - Bullish above 625.07 daily close on 1% Box Size chart. https://t.co/EDqa7dAAKn
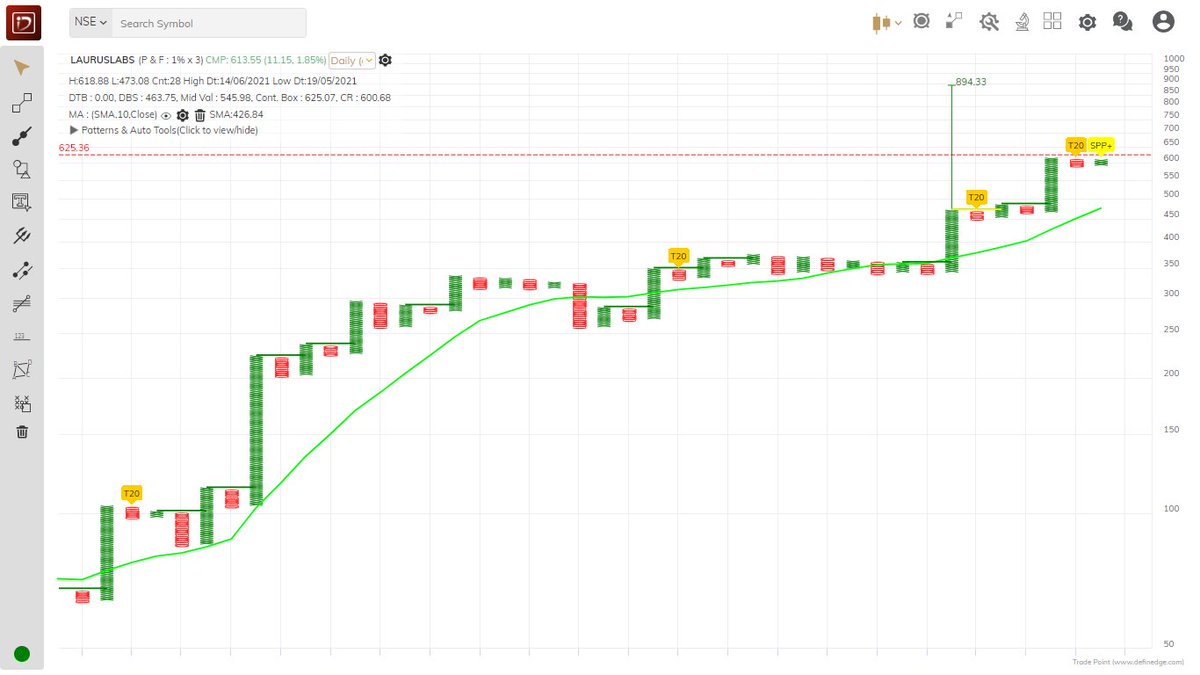
LAURUSLABS
— Saket Reddy (@saketreddy) May 3, 2021
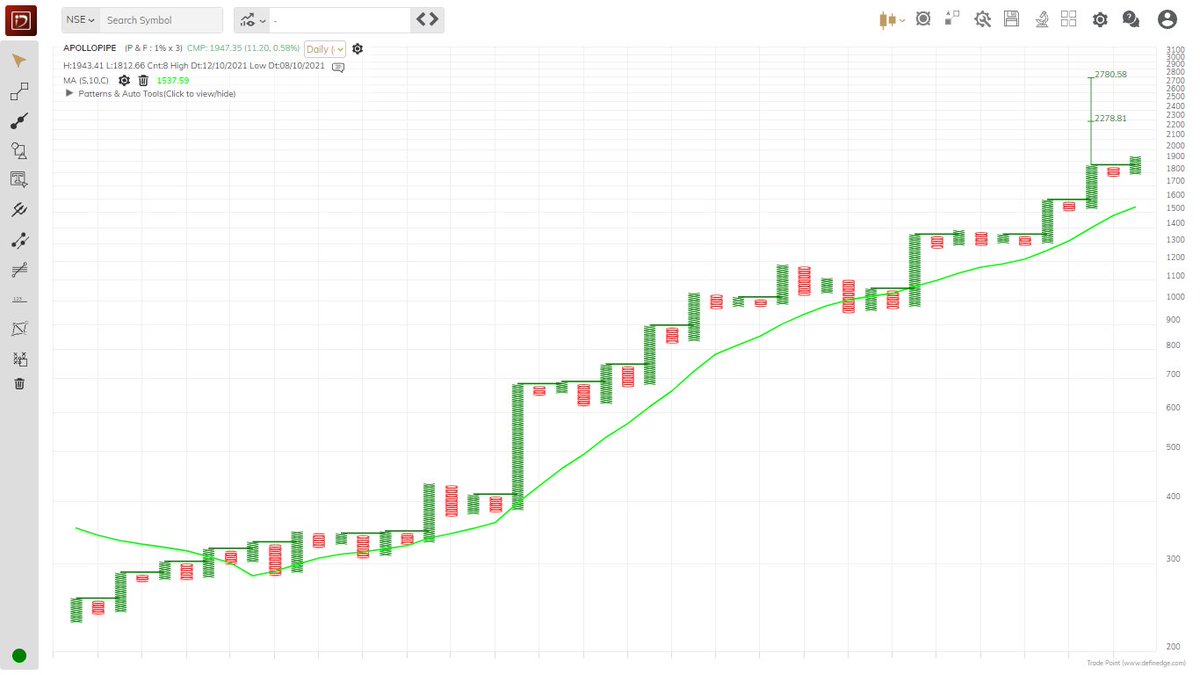
Haters are gonna hate, but IMO, this is the best opportunity to start pyramiding and make it a well sized holding.
A trio of patterns coming together, has one of the highest success rate!
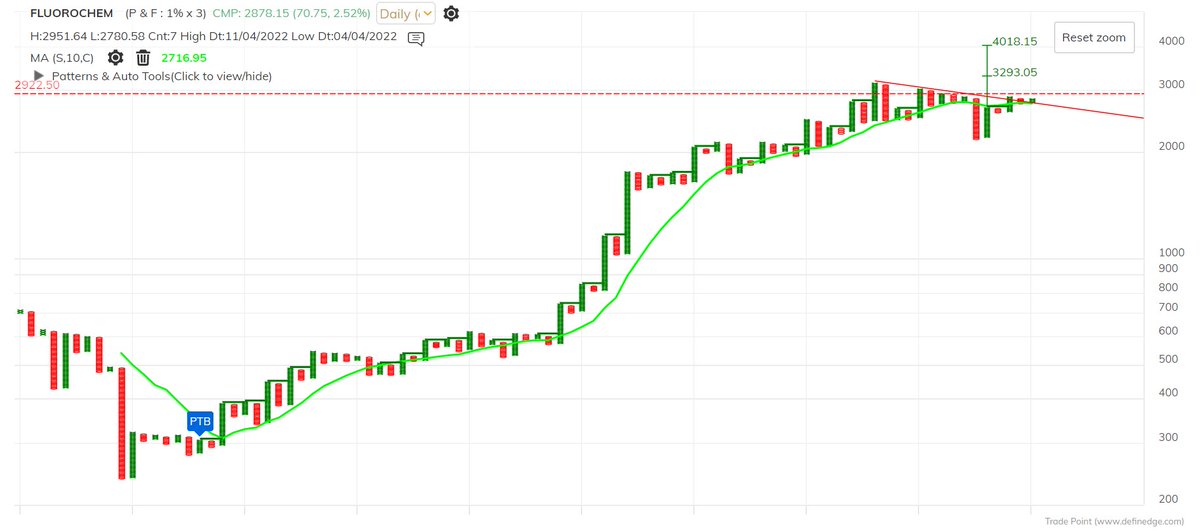
Double Top Buy, T20 Pattern - Bullish & Super pattern - Bullish above 477.81! https://t.co/SqzkTyb9wx pic.twitter.com/hTj7mfAOqy
More from Saregama

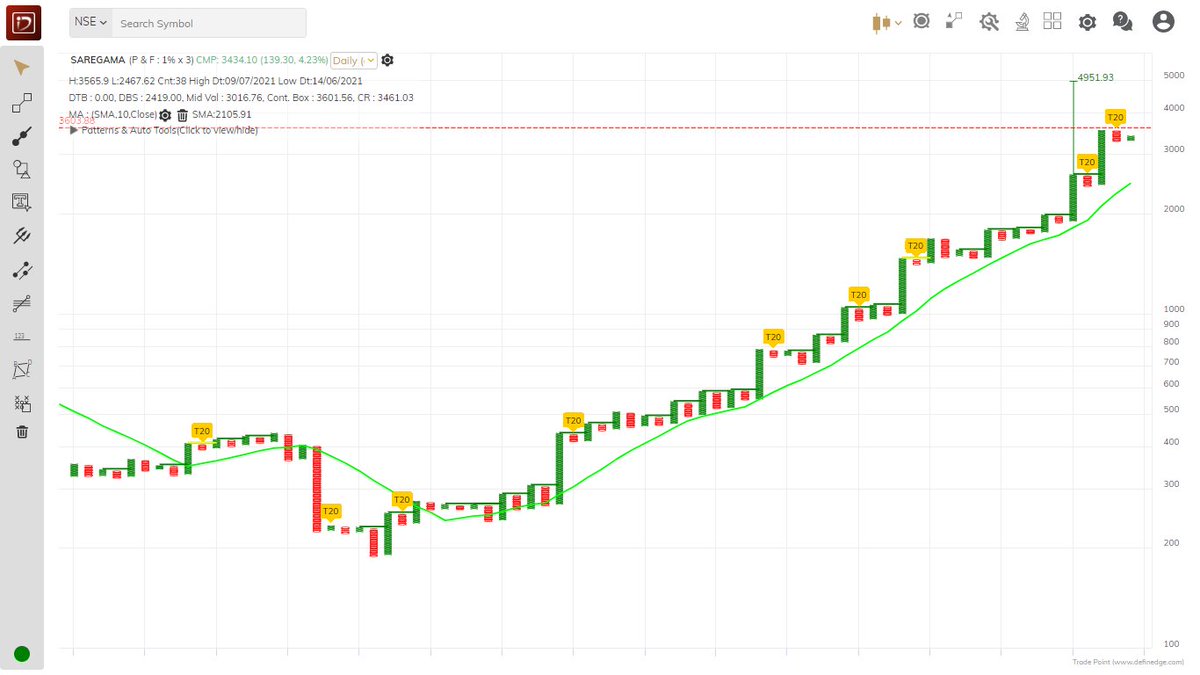
Double Top Buy & T20 Pattern - Bullish above 3601.56 daily close on 1% Box Size chart. https://t.co/3514cyjgDH
SAREGAMA
— Saket Reddy (@saketreddy) June 30, 2021
Today's closing is a monthly close and this is done & dusted, we now have a solid monthly close above the 10 year supply zone.
If the stock has broken out from a 10 year supply zone & a 20 year peak, surely something would've changed!
Do study the industry structure! https://t.co/zA3qztFzon pic.twitter.com/Ld5RVz6CRy


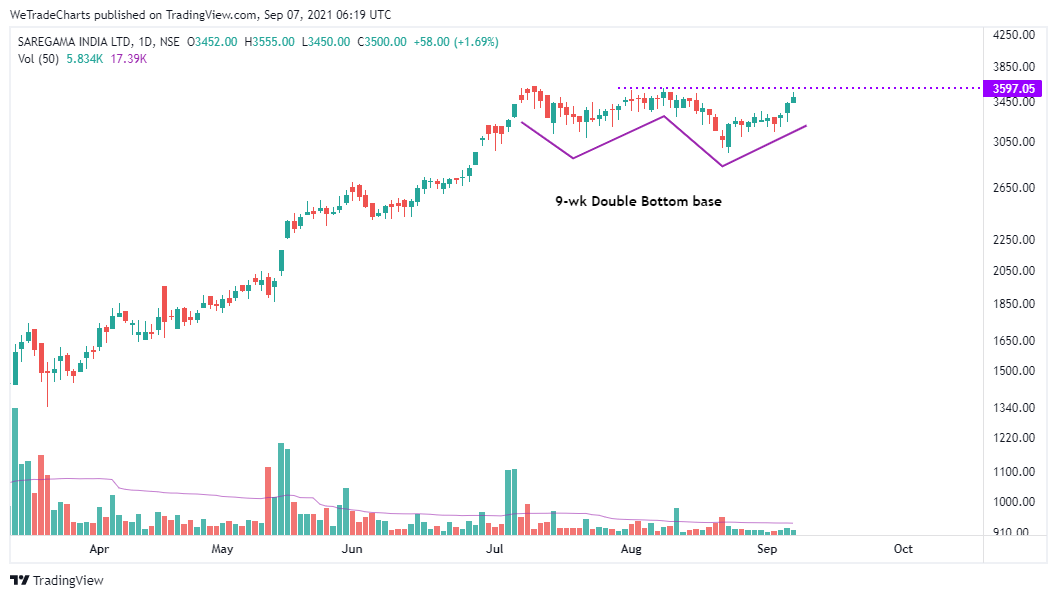

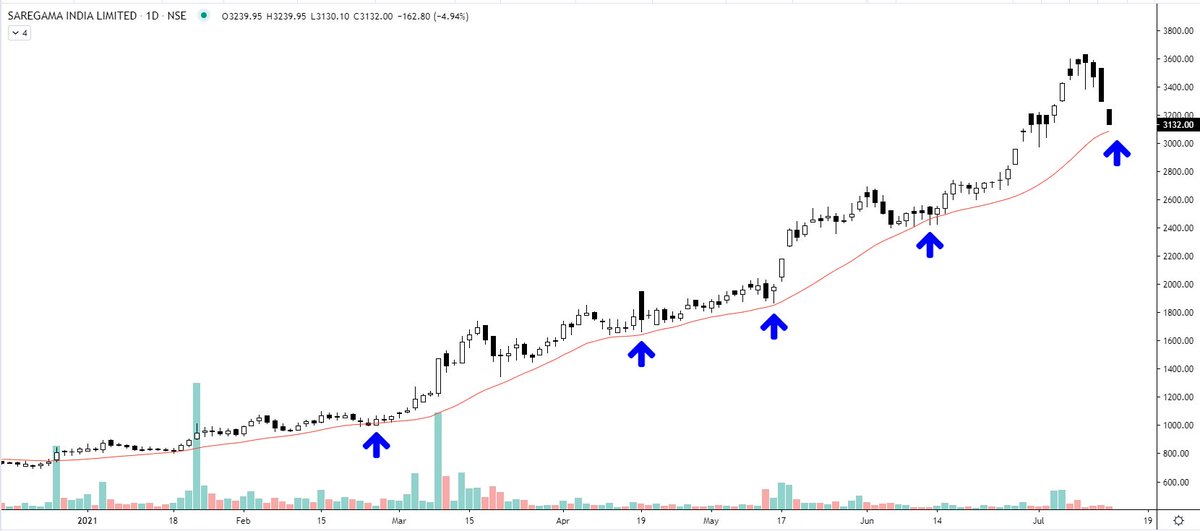
Double Top Buy & T20 Pattern - Bullish triggered above 3596.76 daily close on 3% Box Size chart. https://t.co/130vDnOAzm

SAREGAMA
— Saket Reddy (@saketreddy) July 15, 2021
Double Top Buy & T20 Pattern - Bullish above 3601.56 daily close on 1% Box Size chart. https://t.co/3514cyjgDH pic.twitter.com/pdlyX1pdre
You May Also Like

Pangolins, September 2019 and PLA are the key to this mystery
Stay Tuned!

1. Yang
Meet Yang Ruifu, CCP's biological weapons expert https://t.co/JjB9TLEO95 via @Gnews202064
— Billy Bostickson \U0001f3f4\U0001f441&\U0001f441 \U0001f193 (@BillyBostickson) October 11, 2020
Interesting expose of China's top bioweapons expert who oversaw fake pangolin research
Paper 1: https://t.co/TrXESKLYmJ
Paper 2:https://t.co/9LSJTNCn3l
Pangolinhttps://t.co/2FUAzWyOcv pic.twitter.com/I2QMXgnkBJ
2. A jacobin capuchin dangling a flagellin pangolin on a javelin while playing a mandolin and strangling a mannequin on a paladin's palanquin, said Saladin
More to come tomorrow!

3. Yigang Tong
https://t.co/CYtqYorhzH
Archived: https://t.co/ncz5ruwE2W

4. YT Interview
Some bats & pangolins carry viruses related with SARS-CoV-2, found in SE Asia and in Yunnan, & the pangolins carrying SARS-CoV-2 related viruses were smuggled from SE Asia, so there is a possibility that SARS-CoV-2 were coming from








Beautifully read: why bookselfies are all over Instagram https://t.co/pBQA3JY0xm
— Guardian Books (@GuardianBooks) October 30, 2018
THEY DO READ THEM, YOU JUDGY, RACOON-PICKED TRASH BIN

If you come for Bookstagram, i will fight you.
In appreciation, here are some of my favourite bookstagrams of my books: (photos by lit_nerd37, mybookacademy, bookswrotemystory, and scorpio_books)
