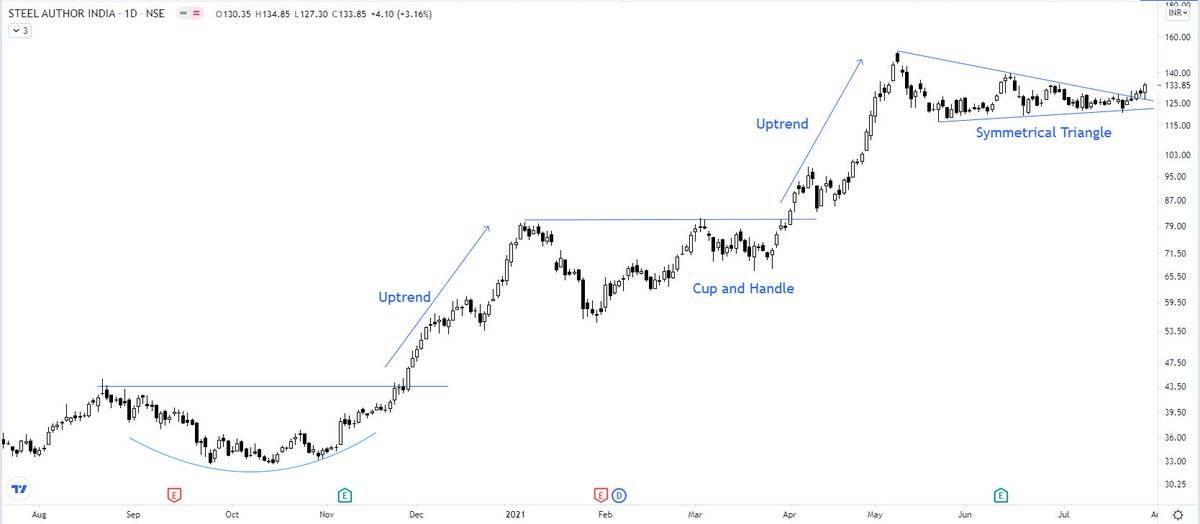
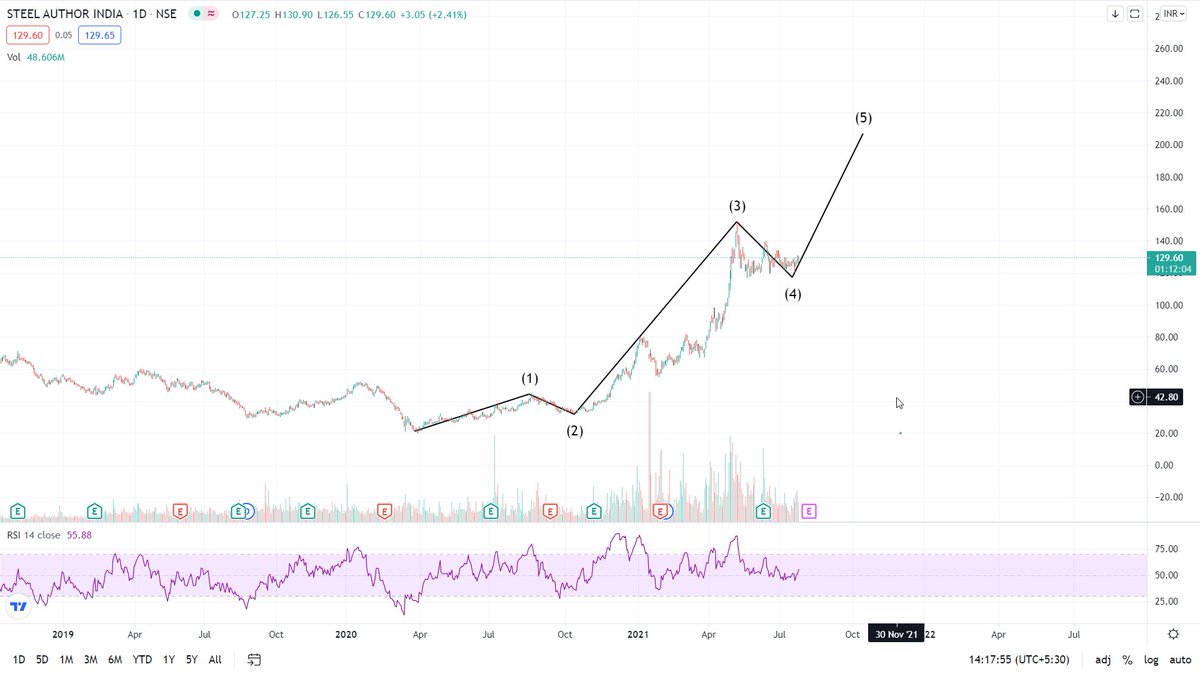
SAIL - I am not holding it as of now. Chart for learning purposes. I always have a bullish bias for a stock in a particular sector that is performing so well.
A typical example of stock taking a pause in between during its upwards journey.
More from Steve Nison
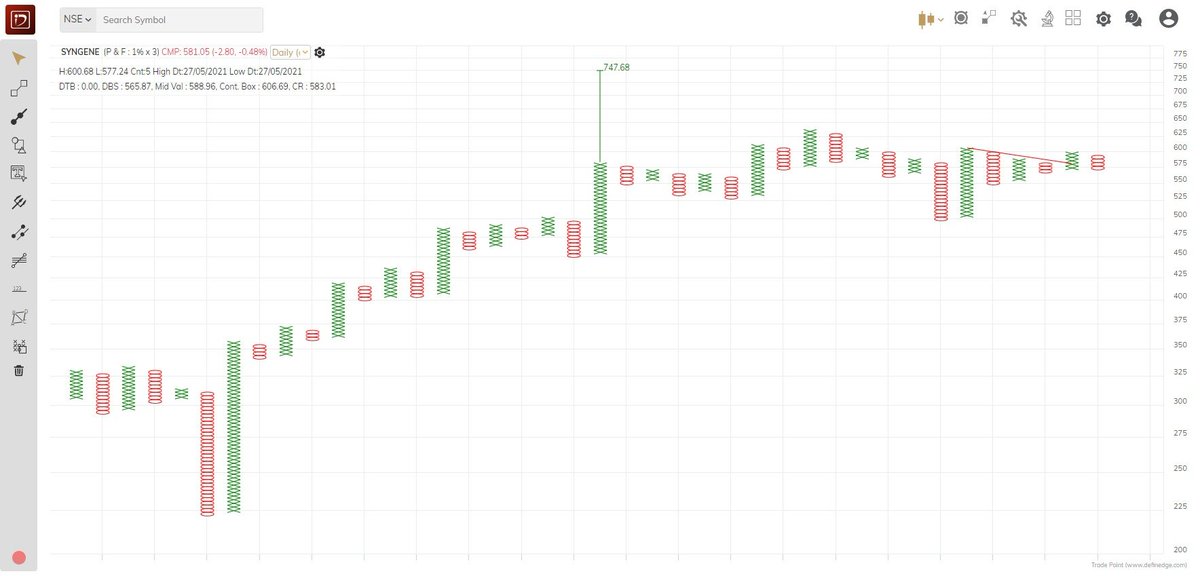
Syngene - Same concept. Price contraction. Shift from weak to strong hands through repeated volatility contractions. I can well write one whole page explanation on it. Look at the volume pump today. A big hand will never let you ride with him. Make sure you are there at the party https://t.co/RN8sQYzdBg pic.twitter.com/AShKWnQeJt
— Steve Nison (@nison_steve) July 15, 2021
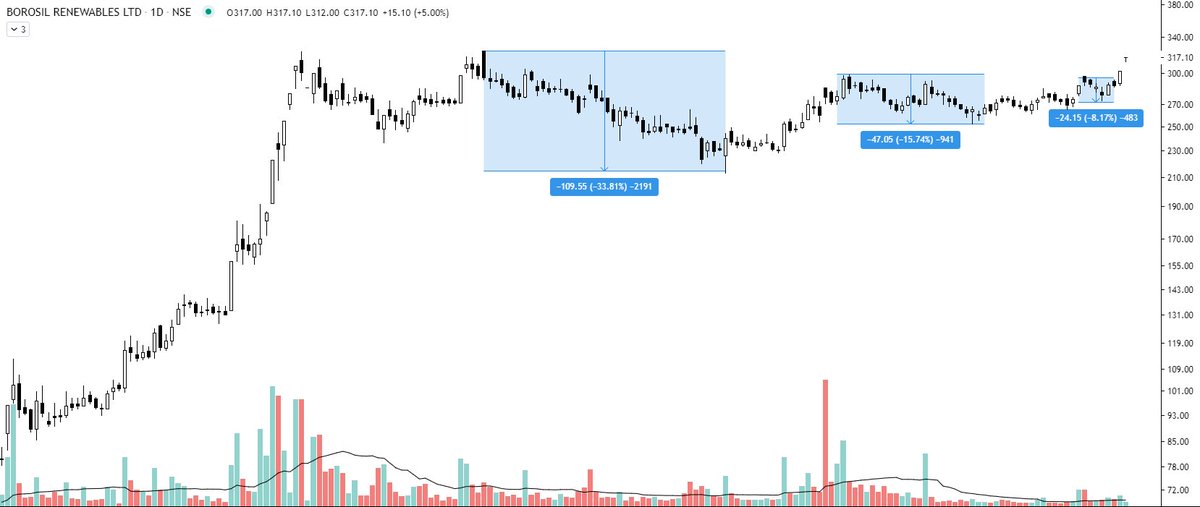
Borosil Renewables - Patterns like these must be looked at carefully and must be kept on the radar. Herein price is contracting which generally signifies shifting of hands (from weak to strong). If you go wrong, the risk is limited in these. pic.twitter.com/iqyoeslZjy
— Steve Nison (@nison_steve) July 12, 2021
Fresh case - RUPA https://t.co/nqq5nI1wLU
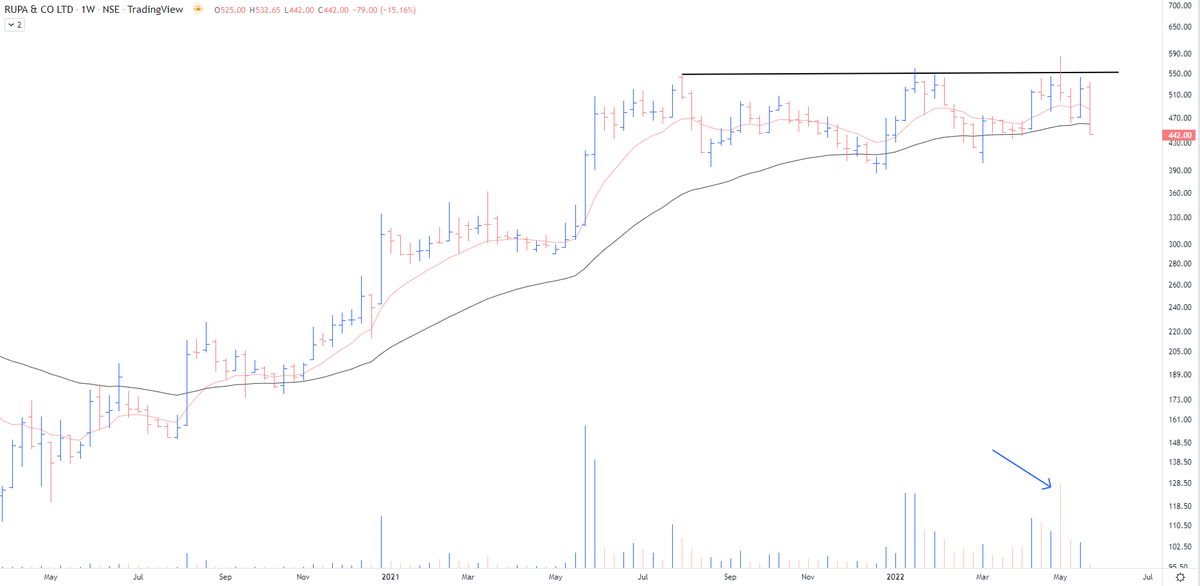
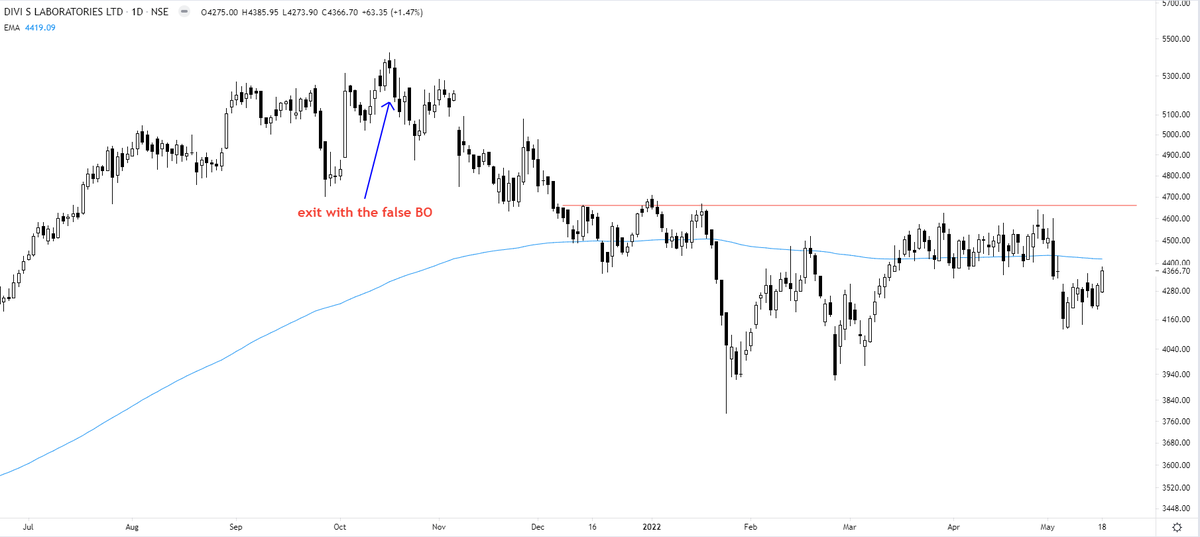
Respect your stop losses in the stocks that have gone down today with heavy volumes even on a strong day.
— The_Chartist \U0001f4c8 (@charts_zone) March 17, 2022
VTL pic.twitter.com/3pJ9XngCDL
More from Sail


#Metals
#Sail Hourly Chart. We could see sellers run for cover above 126. Levels of 120 could be my stop on this one. #Metals pic.twitter.com/2CNvUZbhNY
— Dare2Dream (@Dare2Dr10109801) June 10, 2021


Views are for educational purpose.
Riding from levels of 47 (Refer old tweet, tagged)
Impulse wave cycle + subs, completed and now waves adjusted.
This major wave 5 will only unfold, once it gives a closing above 153 levels on a weekly basis.
Pic 1 is for investors https://t.co/d4xtiRI45j
— Vipul Kankaria (@cobbervipul) May 1, 2021
Another condition (refer 2nd image) is formation of a pennant (giving a sneak peak for a BO, closing awaited).
This is for short term / positional players
OI data is skewed because of expiry & will be misleading currently.
DYOR for opportunities