increase this to 2,200 by FY23.
Domestic MDF market size is pegged at 2500Cr currently & is
expected to grow at 15% CAGR over the next 3 years (organised players to grow even faster).
The
industry further has potential to capture incremental opportunity of 4500-5000Cr low-end plywood market. https://t.co/Cre3xVUNqu
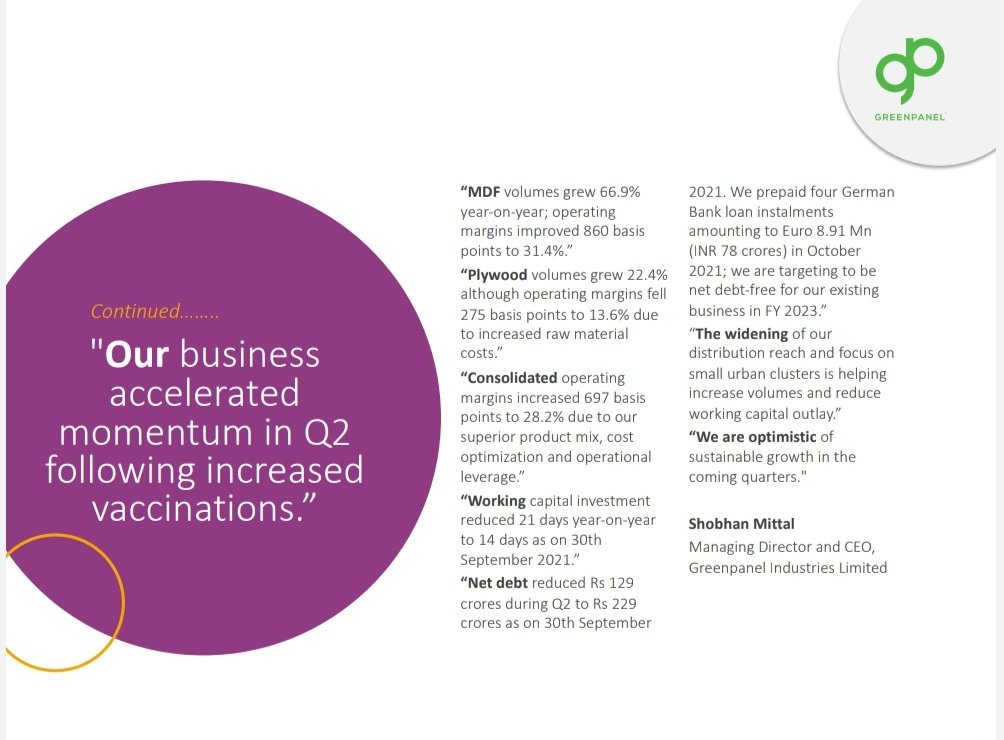
GREENPANEL would grow earnings at 15-20% CAGR over the next 3-5 years with ROCE & Margin expansion once they commision the de-bottlenecked capacity in FY22 and the brownfield AP CAPEX in FY23/FY24.
— Saket Reddy (@saketreddy) October 14, 2021
Huge runway for growth, industry structure (both MDF & RE) turned for the good! https://t.co/jFTZCwhNMS
More from Saket Reddy
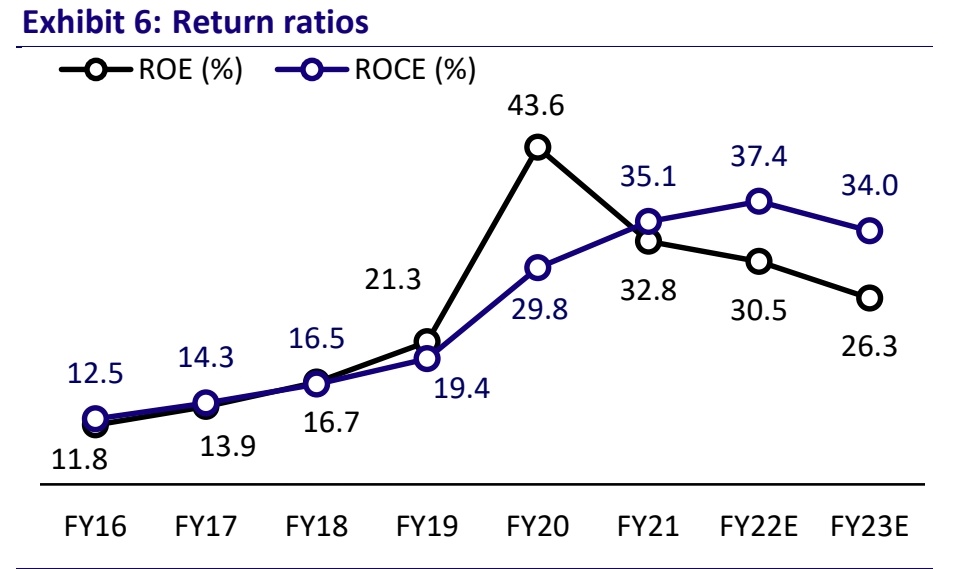
While people were debating figuring out which is the best in ICICI/AXIS & INDUSINDBNK, look what the top 3 high quality banks (HDFCBANK, KOTAKBANK & CUB) have done over the last 5, 10 & 17 years.
They are the real compounders, they've created massive wealth compared to others! https://t.co/PluVwU5OXG
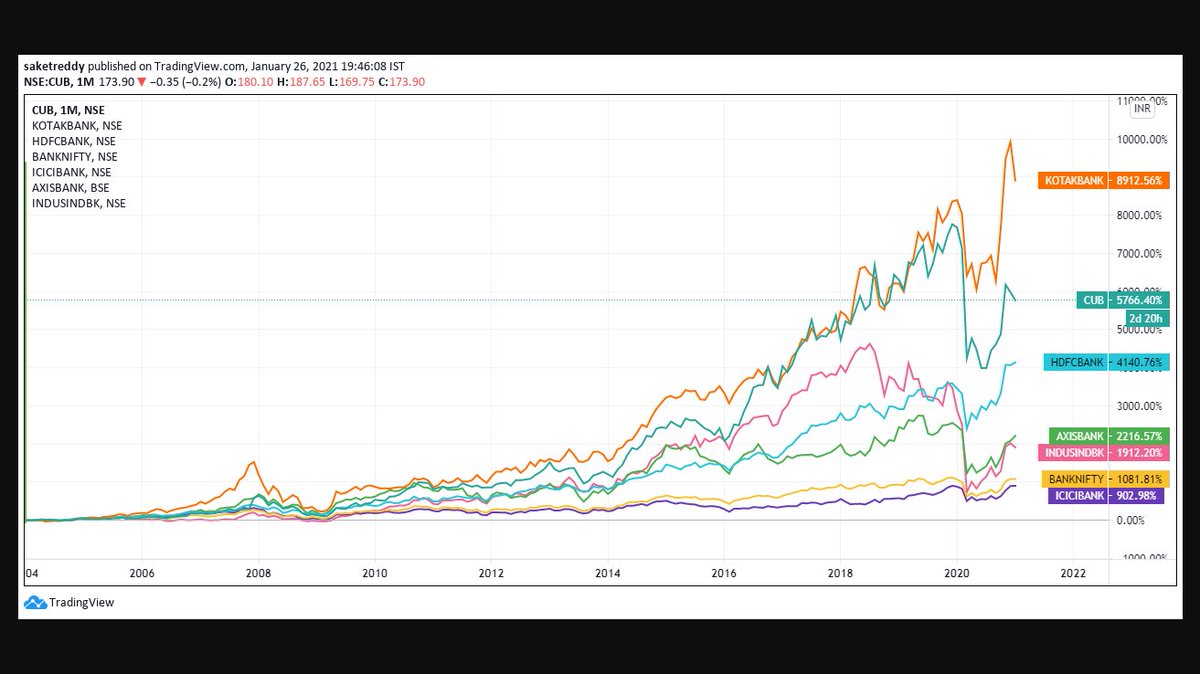
They are the real compounders, they've created massive wealth compared to others! https://t.co/PluVwU5OXG
Hope Everyone saw BANDHANBNK Numbers. I feel many such banks will go through a massive NPA Cycle followed by depleted Tier 1.
— Saket Reddy (@saketreddy) January 24, 2021
Hence, stay with the Top 3 banks :-
HDFCBANK
KOTAKBANK
CUB
They've low cost of funding, well provisioned Moratorium book, high ROEs & high Tier 1 CAR.

More from Real estate





You May Also Like






1/OK, data mystery time.
This New York Times feature shows China with a Gini Index of less than 30, which would make it more equal than Canada, France, or the Netherlands. https://t.co/g3Sv6DZTDE
That's weird. Income inequality in China is legendary.
Let's check this number.
2/The New York Times cites the World Bank's recent report, "Fair Progress? Economic Mobility across Generations Around the World".
The report is available here:
3/The World Bank report has a graph in which it appears to show the same value for China's Gini - under 0.3.
The graph cites the World Development Indicators as its source for the income inequality data.

4/The World Development Indicators are available at the World Bank's website.
Here's the Gini index: https://t.co/MvylQzpX6A
It looks as if the latest estimate for China's Gini is 42.2.
That estimate is from 2012.
5/A Gini of 42.2 would put China in the same neighborhood as the U.S., whose Gini was estimated at 41 in 2013.
I can't find the <30 number anywhere. The only other estimate in the tables for China is from 2008, when it was estimated at 42.8.
This New York Times feature shows China with a Gini Index of less than 30, which would make it more equal than Canada, France, or the Netherlands. https://t.co/g3Sv6DZTDE
That's weird. Income inequality in China is legendary.
Let's check this number.
2/The New York Times cites the World Bank's recent report, "Fair Progress? Economic Mobility across Generations Around the World".
The report is available here:
3/The World Bank report has a graph in which it appears to show the same value for China's Gini - under 0.3.
The graph cites the World Development Indicators as its source for the income inequality data.
4/The World Development Indicators are available at the World Bank's website.
Here's the Gini index: https://t.co/MvylQzpX6A
It looks as if the latest estimate for China's Gini is 42.2.
That estimate is from 2012.
5/A Gini of 42.2 would put China in the same neighborhood as the U.S., whose Gini was estimated at 41 in 2013.
I can't find the <30 number anywhere. The only other estimate in the tables for China is from 2008, when it was estimated at 42.8.