#LTTS
#LLTS Weekly chart shows the stock is recovering from 61.8% fibonacci pullback of last major rise
— Techno Prince (@Trader_souradep) July 24, 2022
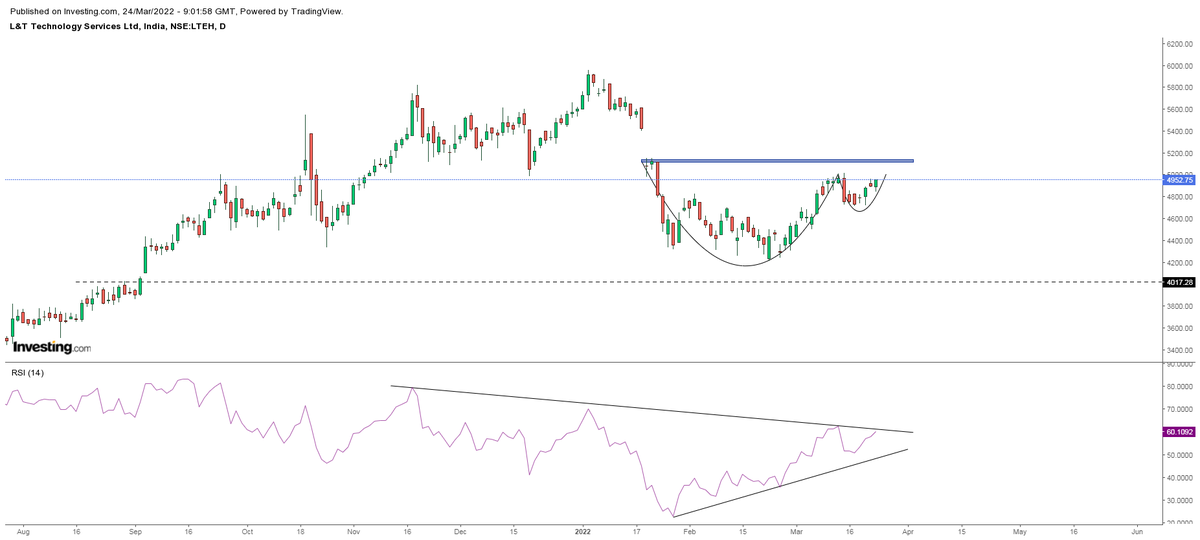
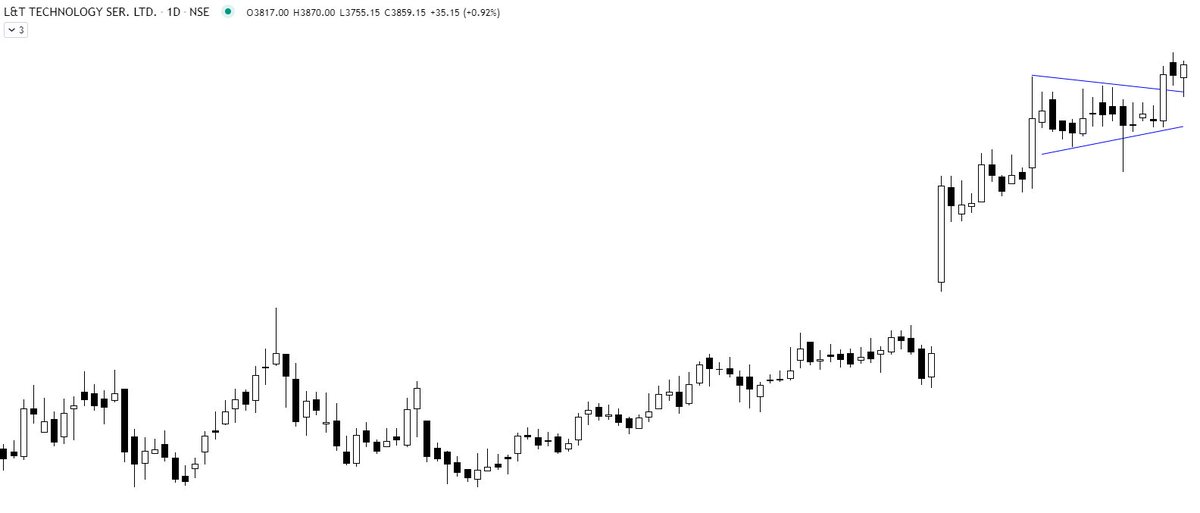
Daily chart shows a a rounding bottom , daily RSI bullish
If it sustains above 3500 it can move towards 3900+ levels and later towards 200 DMA 4480#Nifty pic.twitter.com/6ebtfLMJZd
More from Techno Prince


More from Ltts

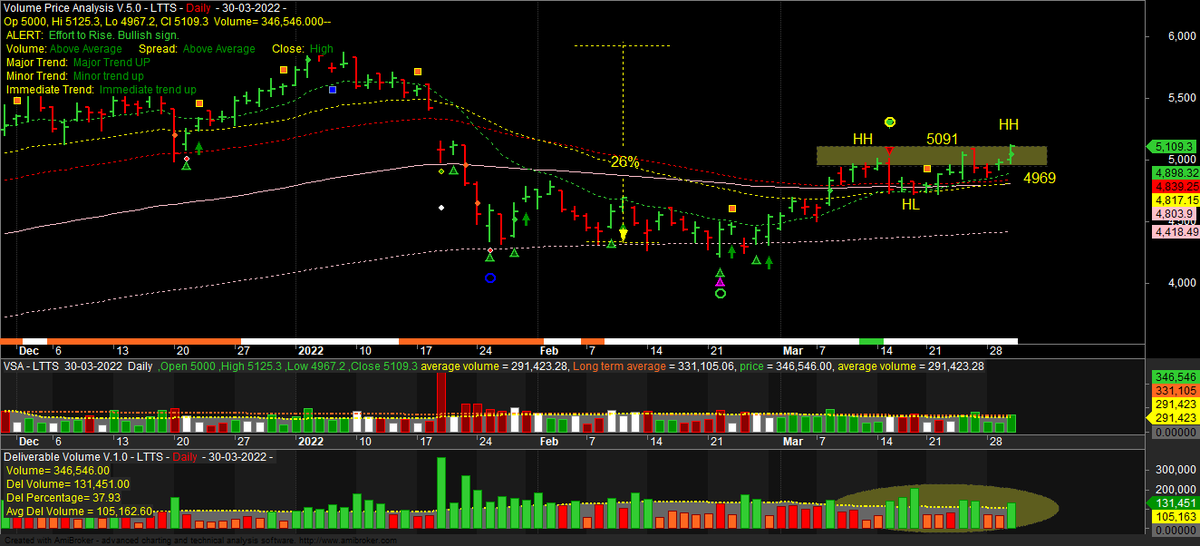

#LTTS-5314
Objective is to move higher towards Fibonacci extension
6.857%..(6892)
#Probability
Objective is to move higher towards Fibonacci extension
6.857%..(6892)
#Probability
#LTTS-4897
— Waves_Perception(Dinesh Patel) \u092e\u0948\u0902Schedule Tribes) (@idineshptl) October 14, 2021
Sustain rise above 4.618%(4967)
Upside projection ploted on chart
6.857%(6892)#Probability https://t.co/h28c8TImIG