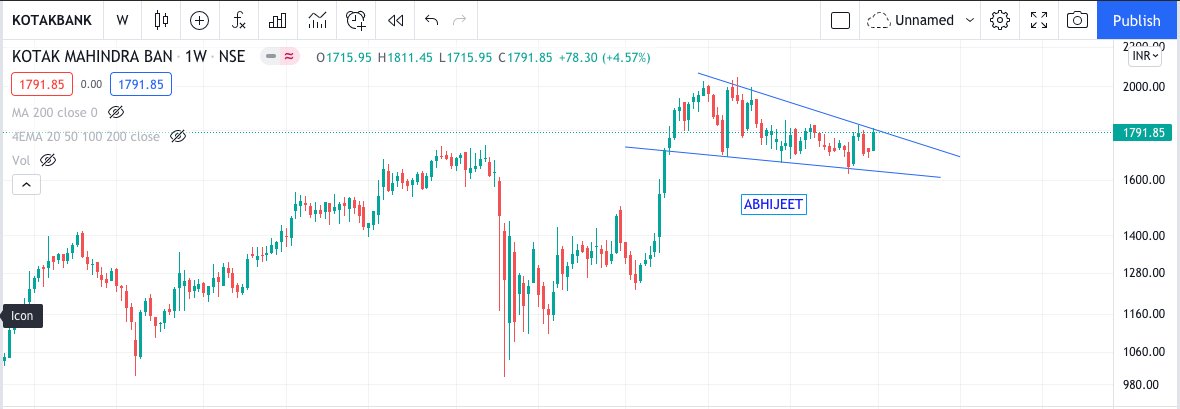
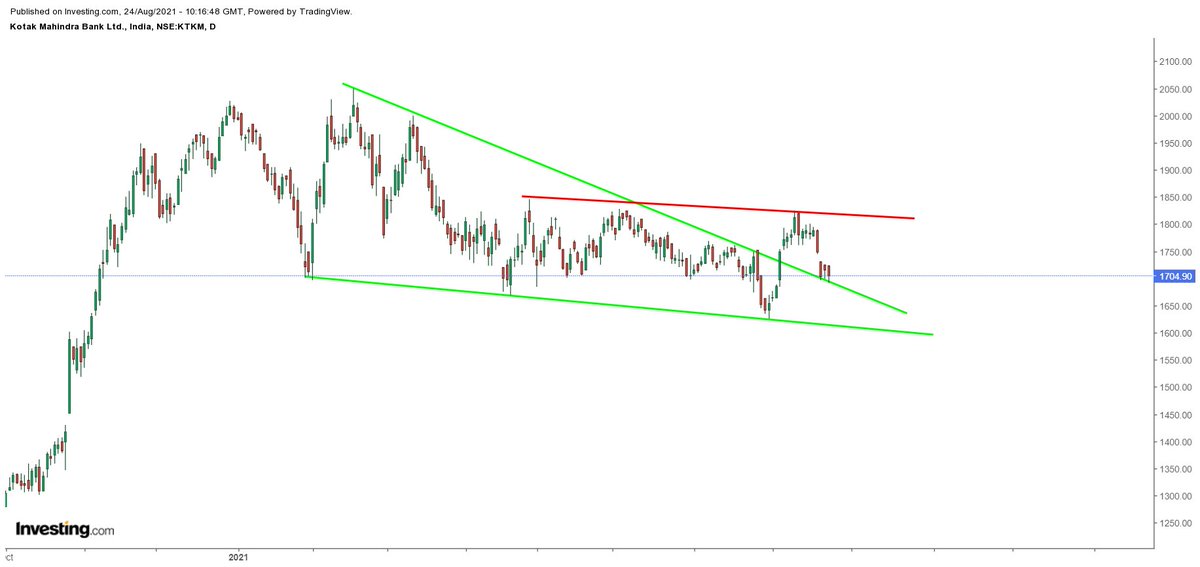
#KOTAKBANK-1790
Near term base 1738.(1688)
#Probability

More from MaRkET WaVES (DINESH PATEL ) Stock Market FARMER
#LTI -4614
Probability towards 4.618% and beyond..
#Possibility
Probability towards 4.618% and beyond..
#Possibility
#LTI -4145
— MaRkET WaVES (DINESH PATEL ) Stock Market FARMER (@idineshptl) July 14, 2021
Near term base Case (4024)
Look for 4.618% and 6.857%
Long term perspective Fibonacci extension shown in chart. #Perspective pic.twitter.com/Pyl0aGYIuS
#CDSL -1337
Either entry only above 1600 or let it
correct towards 987...
#Update
Either entry only above 1600 or let it
correct towards 987...
#Update
#CDSL -1050
— MaRkET WaVES (DINESH PATEL ) Stock Market FARMER (@idineshptl) July 9, 2021
Now above 2.618% and objective is to move higher towards 3.618%
4.236% and 4.618%....
What will Drag lower this stock price \U0001f602 ?
Only if you can sell your holding
Means Verticle rise ?
Than why it decline from (486-180.)#Observation #Perspective pic.twitter.com/evxYOjH8Qv

More from Kotakbank


You May Also Like


1/OK, data mystery time.
This New York Times feature shows China with a Gini Index of less than 30, which would make it more equal than Canada, France, or the Netherlands. https://t.co/g3Sv6DZTDE
That's weird. Income inequality in China is legendary.
Let's check this number.
2/The New York Times cites the World Bank's recent report, "Fair Progress? Economic Mobility across Generations Around the World".
The report is available here:
3/The World Bank report has a graph in which it appears to show the same value for China's Gini - under 0.3.
The graph cites the World Development Indicators as its source for the income inequality data.

4/The World Development Indicators are available at the World Bank's website.
Here's the Gini index: https://t.co/MvylQzpX6A
It looks as if the latest estimate for China's Gini is 42.2.
That estimate is from 2012.
5/A Gini of 42.2 would put China in the same neighborhood as the U.S., whose Gini was estimated at 41 in 2013.
I can't find the <30 number anywhere. The only other estimate in the tables for China is from 2008, when it was estimated at 42.8.
This New York Times feature shows China with a Gini Index of less than 30, which would make it more equal than Canada, France, or the Netherlands. https://t.co/g3Sv6DZTDE
That's weird. Income inequality in China is legendary.
Let's check this number.
2/The New York Times cites the World Bank's recent report, "Fair Progress? Economic Mobility across Generations Around the World".
The report is available here:
3/The World Bank report has a graph in which it appears to show the same value for China's Gini - under 0.3.
The graph cites the World Development Indicators as its source for the income inequality data.
4/The World Development Indicators are available at the World Bank's website.
Here's the Gini index: https://t.co/MvylQzpX6A
It looks as if the latest estimate for China's Gini is 42.2.
That estimate is from 2012.
5/A Gini of 42.2 would put China in the same neighborhood as the U.S., whose Gini was estimated at 41 in 2013.
I can't find the <30 number anywhere. The only other estimate in the tables for China is from 2008, when it was estimated at 42.8.