Trading is a probability business so don't be so attached to it. Remember market closes by 3:30 p.m then u have family, friends etc... which u need to make your priority
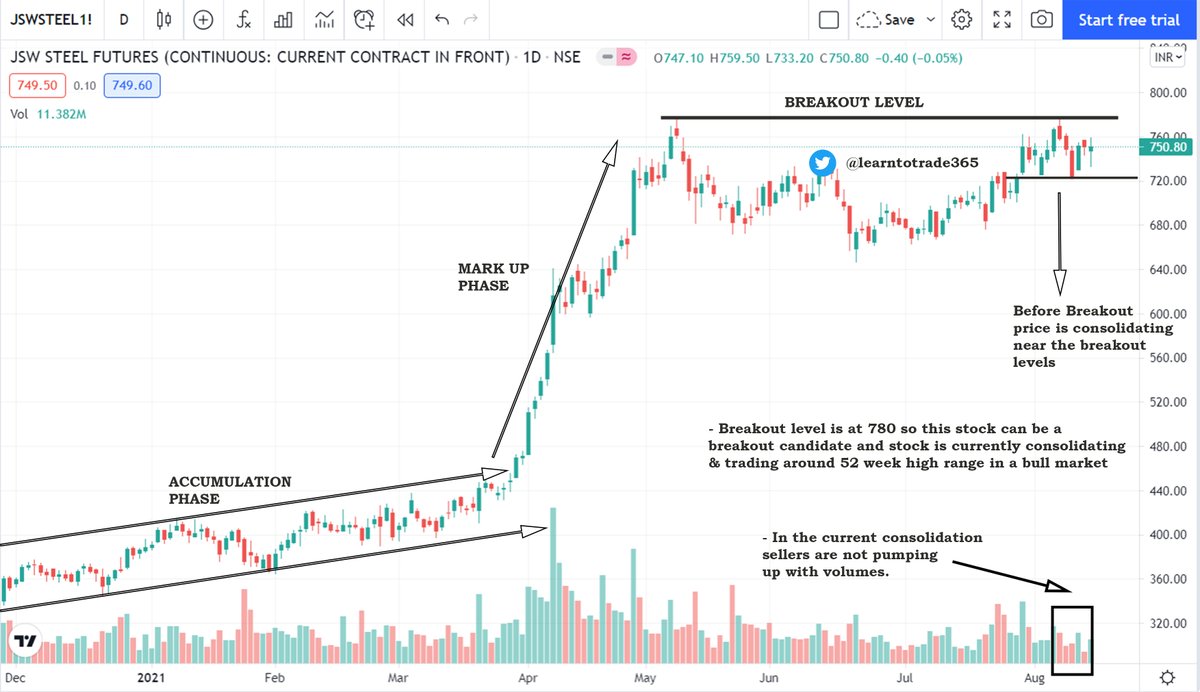
Today's stock - JSW steel
@ca_mehtaravi @Prakashplutus @VijayThk @hjyadav @charts_breakout @BissaGauravB
More from Learn to Trade


Whether OI works for intraday trading ?
Whether OI useful ?
No one has a exact answer. But one effective way to make use OI in a very different perspective - OUT OF THE BOX from Traditional method
Read the full thread 🧵
Kindly RETWEET & share so it can reach many traders
I do Live Market session every Monday to Friday by 09:00 a.m to 01:00 pm . Also i share important support /resistance levels of Banknifty & Nifty on the Telegram Channel. FOLLOW US @learntotrade365
Join the Telegram Channel - https://t.co/VU0bCGAX9s
Scroll down 👇
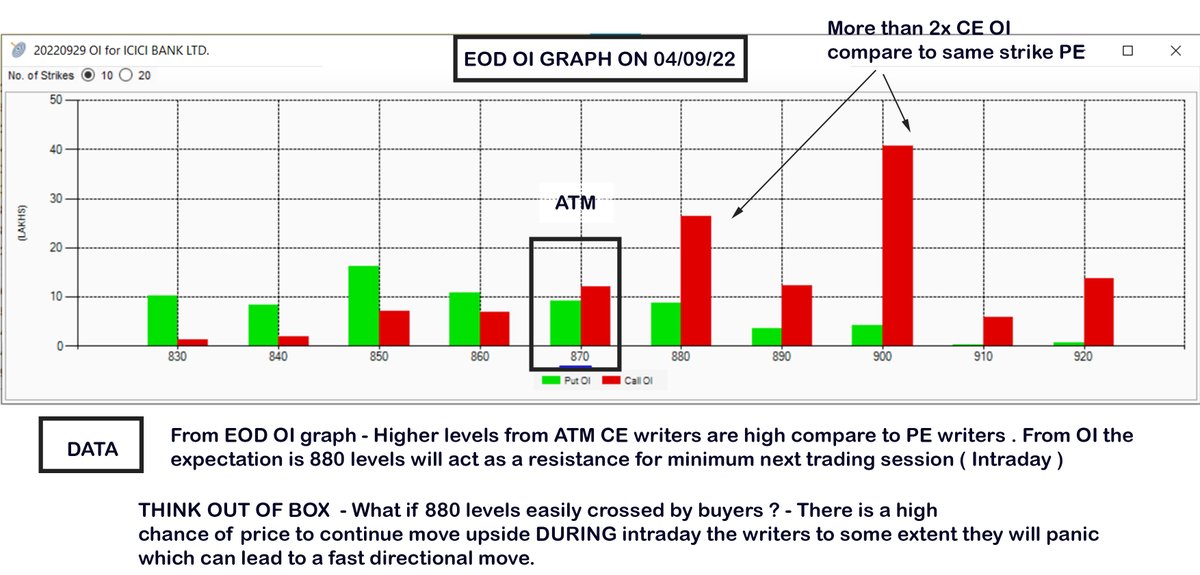
This is a EOD OI graph of ICICIBANK. Here i am trying to focus on strike price which has more than 2x OI comparing CE vs PE of individual strikes.
Below 880 strike CE vs PE in which 880 CE has 2x more OI (more writers) compare to 880 pe.
Read the message in the image
Scroll 👇
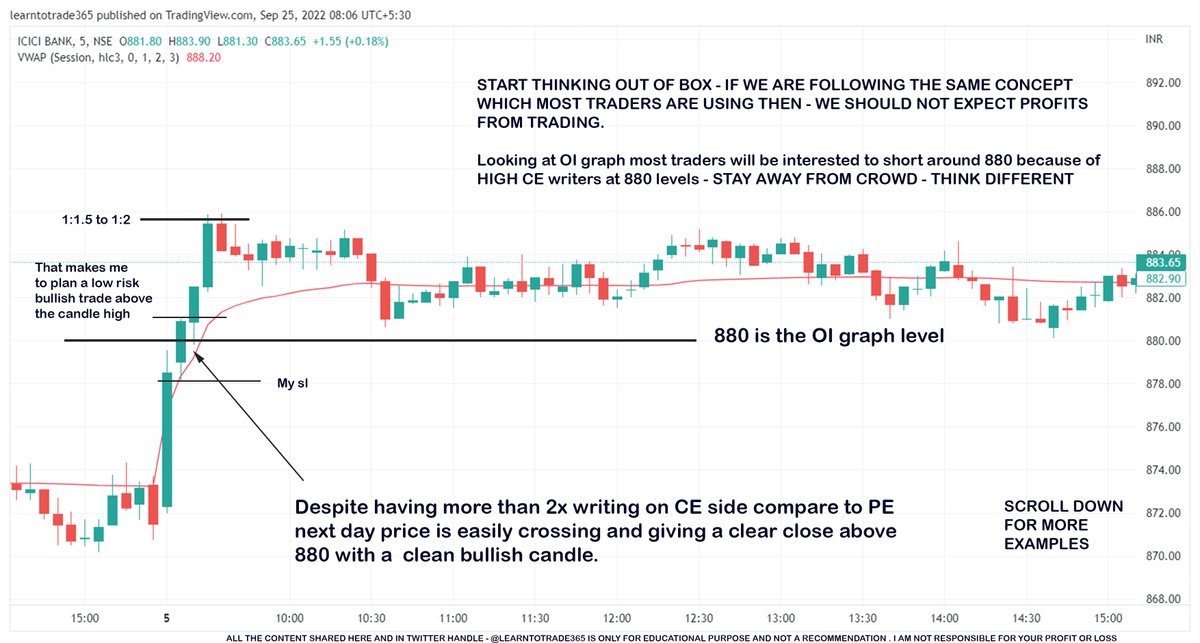
From the above OI graph of EOD 04/09 NOW refer the chart below of the same ICICIBANK for 05 sep
Main focus is not to take 880 levels as resistance just because of more CE OI. My focus if 880 is easily crossing and closing above it to open a bullish opportunity
Scroll👇
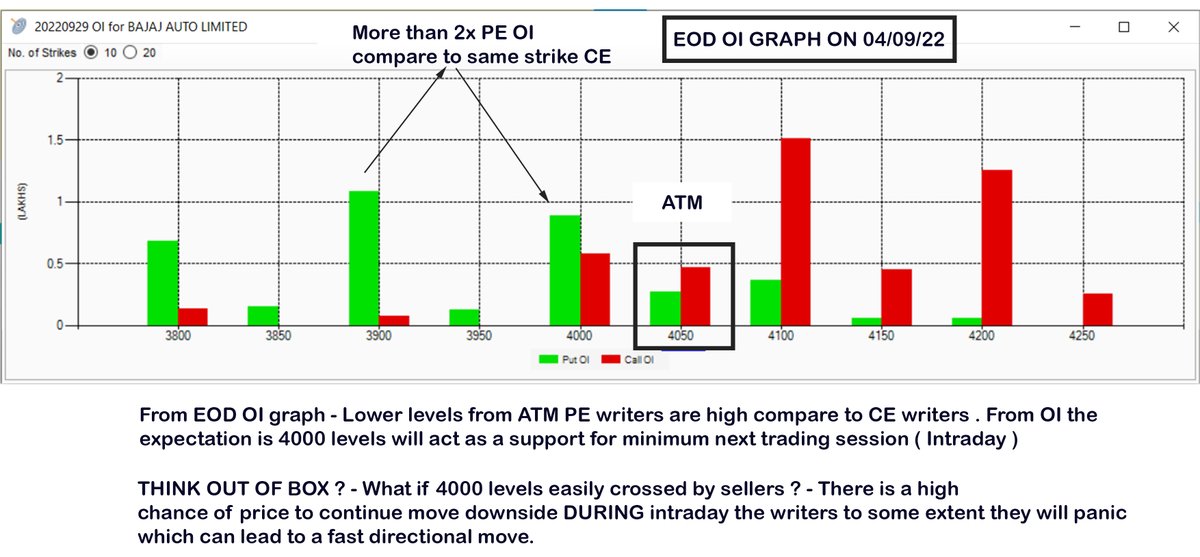
EOD OI graph of Bajaj Auto. Here i am trying to focus on strike price which has more than or equal 2x OI comparing CE vs PE of individual strikes.
Below 4000 strike CE vs PE in which 4000 PE has 2x more OI compare to 4000 CE.
Read the content in the below image
Scroll👇
Whether OI useful ?
No one has a exact answer. But one effective way to make use OI in a very different perspective - OUT OF THE BOX from Traditional method
Read the full thread 🧵
Kindly RETWEET & share so it can reach many traders
I do Live Market session every Monday to Friday by 09:00 a.m to 01:00 pm . Also i share important support /resistance levels of Banknifty & Nifty on the Telegram Channel. FOLLOW US @learntotrade365
Join the Telegram Channel - https://t.co/VU0bCGAX9s
Scroll down 👇
This is a EOD OI graph of ICICIBANK. Here i am trying to focus on strike price which has more than 2x OI comparing CE vs PE of individual strikes.
Below 880 strike CE vs PE in which 880 CE has 2x more OI (more writers) compare to 880 pe.
Read the message in the image
Scroll 👇
From the above OI graph of EOD 04/09 NOW refer the chart below of the same ICICIBANK for 05 sep
Main focus is not to take 880 levels as resistance just because of more CE OI. My focus if 880 is easily crossing and closing above it to open a bullish opportunity
Scroll👇
EOD OI graph of Bajaj Auto. Here i am trying to focus on strike price which has more than or equal 2x OI comparing CE vs PE of individual strikes.
Below 4000 strike CE vs PE in which 4000 PE has 2x more OI compare to 4000 CE.
Read the content in the below image
Scroll👇
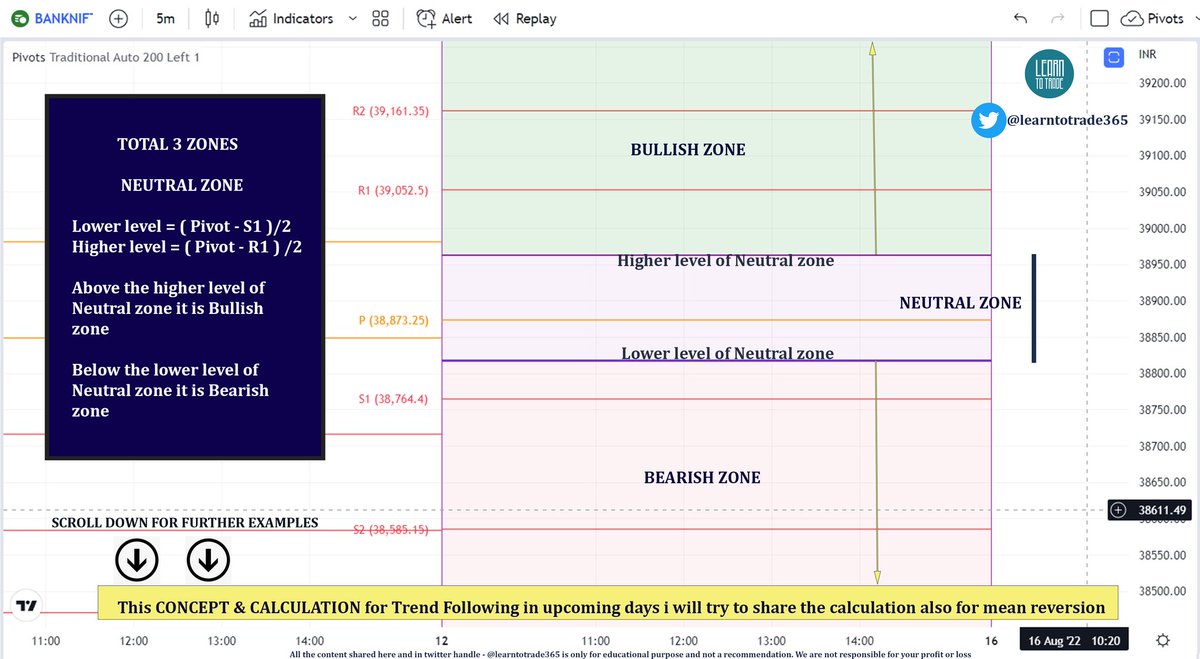
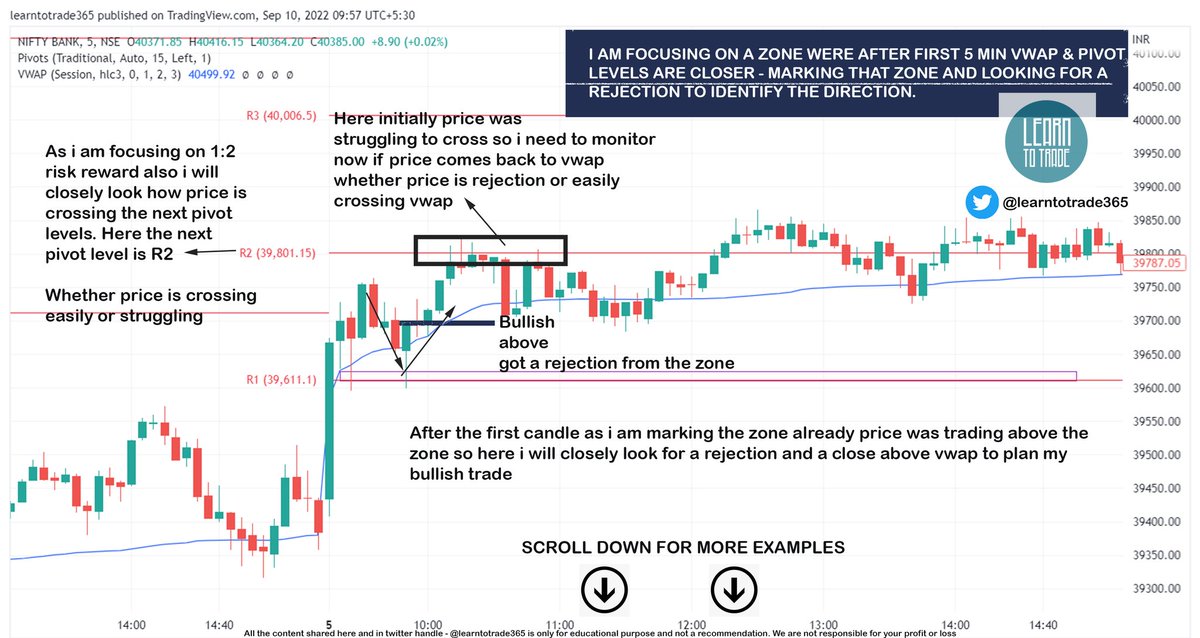
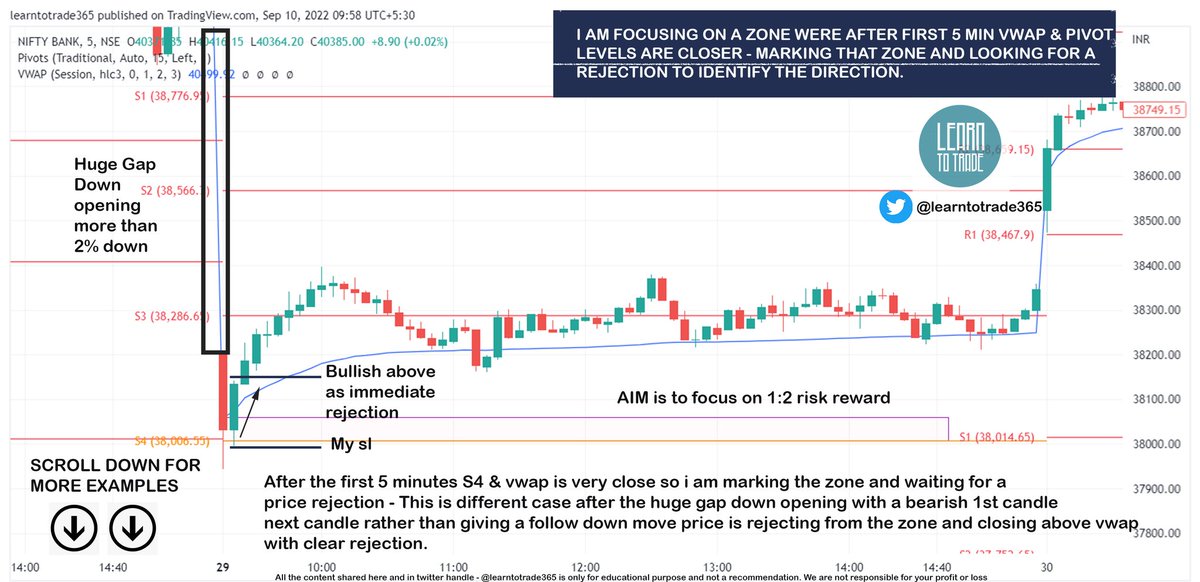
Vwap & Pivot Points - Trading Zones for intraday directional traders
Intraday Trading strategy for Trend followers 🧵
Support us by RETWEET this tweet to reach and benefit most traders so it can help them to gain knowledge
Scroll down 👇
I also do All Trading day Live Market session during Market hours from morning 9:00 a.m to 01:00 p.m - Follow me @learntotrade365
Join the Telegram channel for Live Market updates and live session immediate notification
https://t.co/VU0bCGjU7s
Scroll down for chart examples 👇
Make your Trading system very simple so your main aim is to focus on the price not on various indicators.
Scroll down for more examples 👇
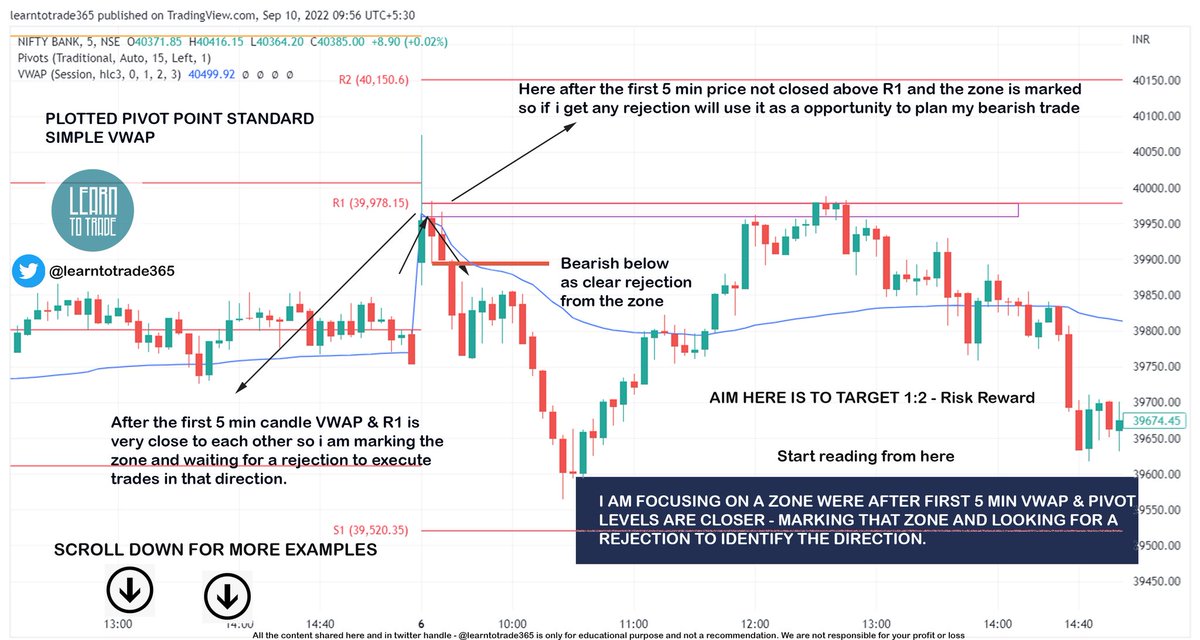
Rather than chasing the price looking at candle colours start trading in a perspective of risk to reward based approach
Scroll down for more examples 👇
Try to understand what retail traders will do. Even in this below example after looking at more than 2% gap down many traders will not much think to plan a bullish trade but chart is showing Sellers are not making a Follow through downmove
Scroll down for more examples 👇
Intraday Trading strategy for Trend followers 🧵
Support us by RETWEET this tweet to reach and benefit most traders so it can help them to gain knowledge
Scroll down 👇
I also do All Trading day Live Market session during Market hours from morning 9:00 a.m to 01:00 p.m - Follow me @learntotrade365
Join the Telegram channel for Live Market updates and live session immediate notification
https://t.co/VU0bCGjU7s
Scroll down for chart examples 👇
Make your Trading system very simple so your main aim is to focus on the price not on various indicators.
Scroll down for more examples 👇
Rather than chasing the price looking at candle colours start trading in a perspective of risk to reward based approach
Scroll down for more examples 👇
Try to understand what retail traders will do. Even in this below example after looking at more than 2% gap down many traders will not much think to plan a bullish trade but chart is showing Sellers are not making a Follow through downmove
Scroll down for more examples 👇
Learning Web series for Traders
Price Action Trading - Part 1
Small thread /Video
Video link - https://t.co/7V2pz0aCdx
Traders support by like & retweet to benefit all
@Mitesh_Engr @ITRADE191 @ProdigalTrader @nakulvibhor @RajarshitaS @Stockstudy8 @vivbajaj @Prakashplutus https://t.co/ZKBMSEZkTl

1/4 Engulfing Candle along with the trend. In this case bullish trend. Scroll down and check the example. Also in a video format ( Video link - https://t.co/7V2pz0aCdx )
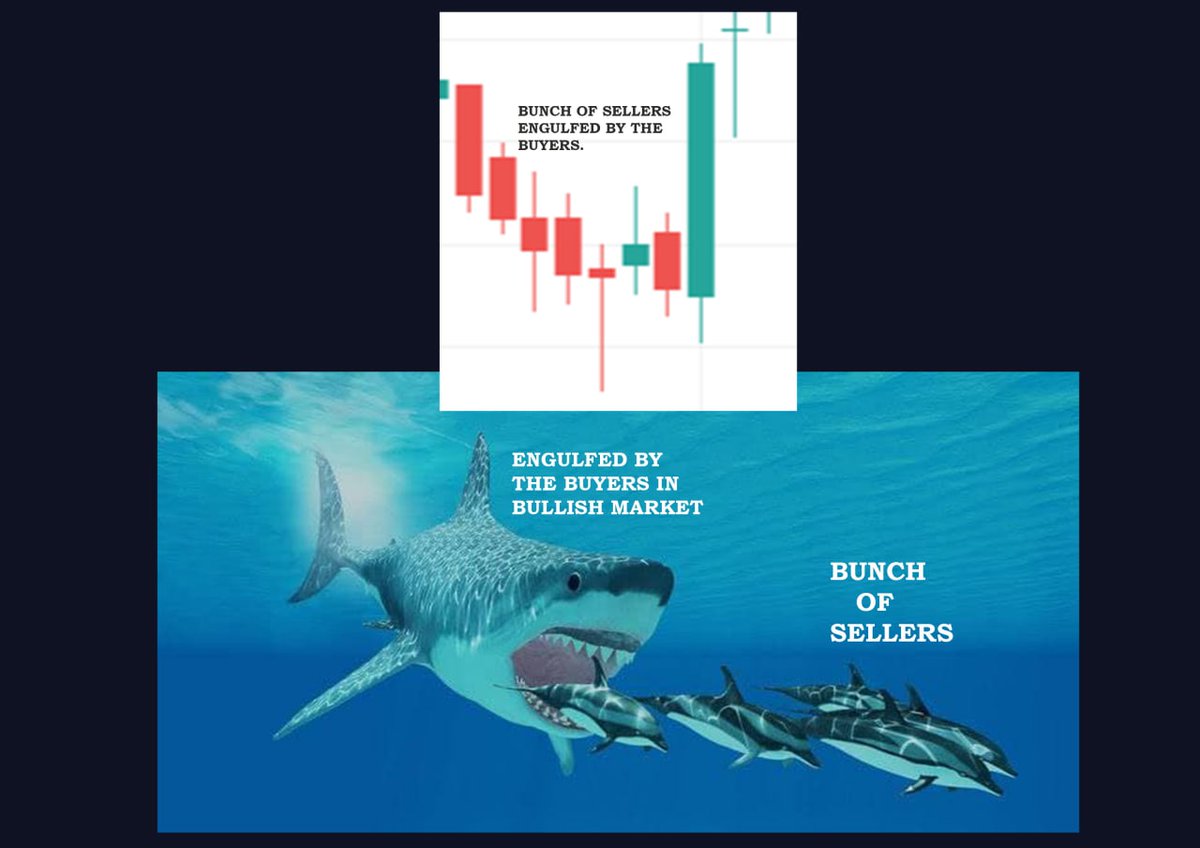
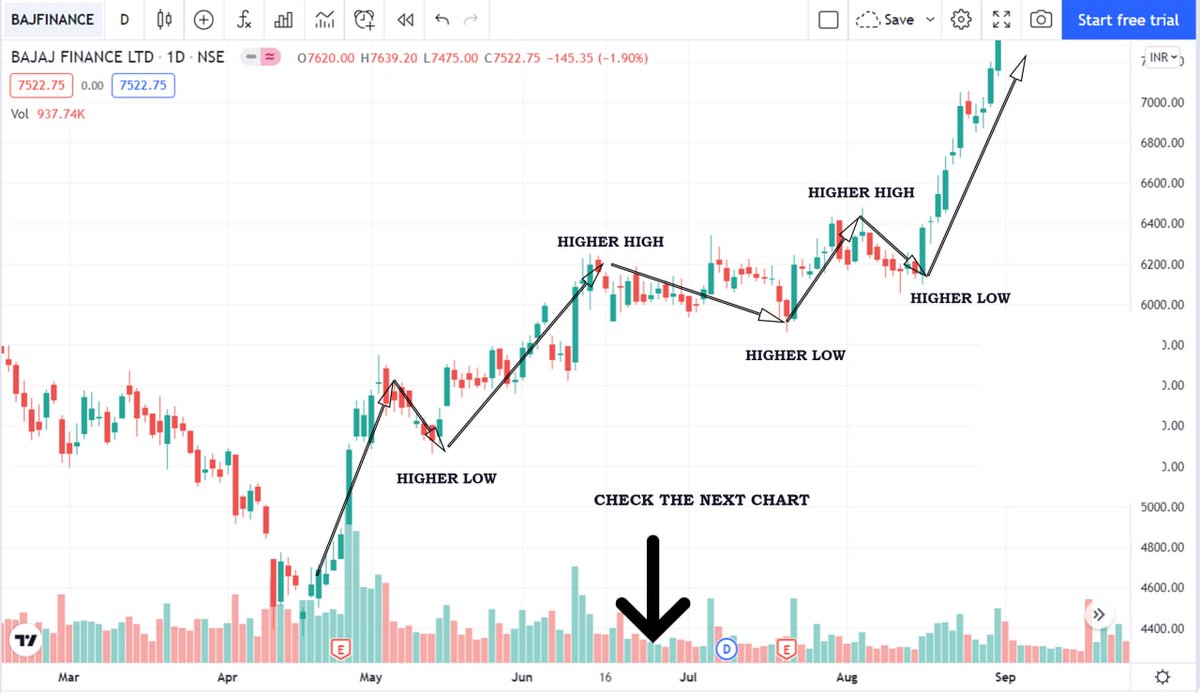
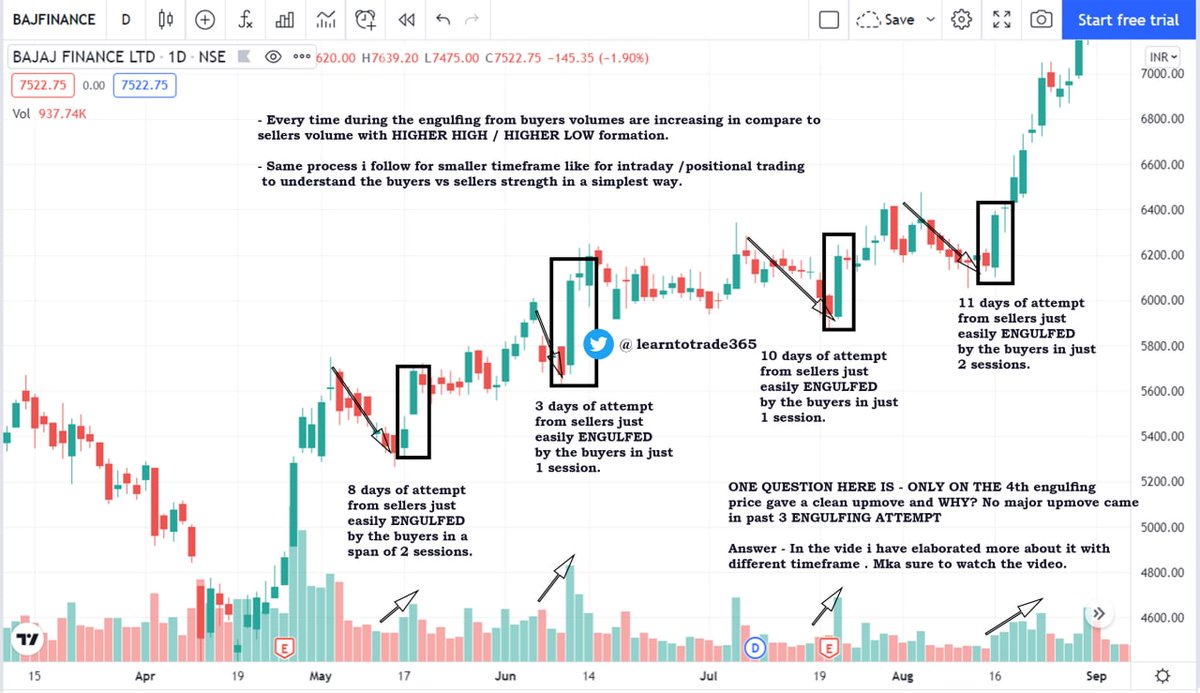
Higher High & Higher low is common in bull market but to understand the traders strength need to read the auction in the consolidated sideways range. So I have explained a simple engulfing concept. Scroll down

3/4
Video link - https://t.co/7V2pz0aCdx
Price Action Trading - Part 1
Small thread /Video
Video link - https://t.co/7V2pz0aCdx
Traders support by like & retweet to benefit all
@Mitesh_Engr @ITRADE191 @ProdigalTrader @nakulvibhor @RajarshitaS @Stockstudy8 @vivbajaj @Prakashplutus https://t.co/ZKBMSEZkTl
1/4 Engulfing Candle along with the trend. In this case bullish trend. Scroll down and check the example. Also in a video format ( Video link - https://t.co/7V2pz0aCdx )
Higher High & Higher low is common in bull market but to understand the traders strength need to read the auction in the consolidated sideways range. So I have explained a simple engulfing concept. Scroll down
3/4
Video link - https://t.co/7V2pz0aCdx
More from Jswsteel

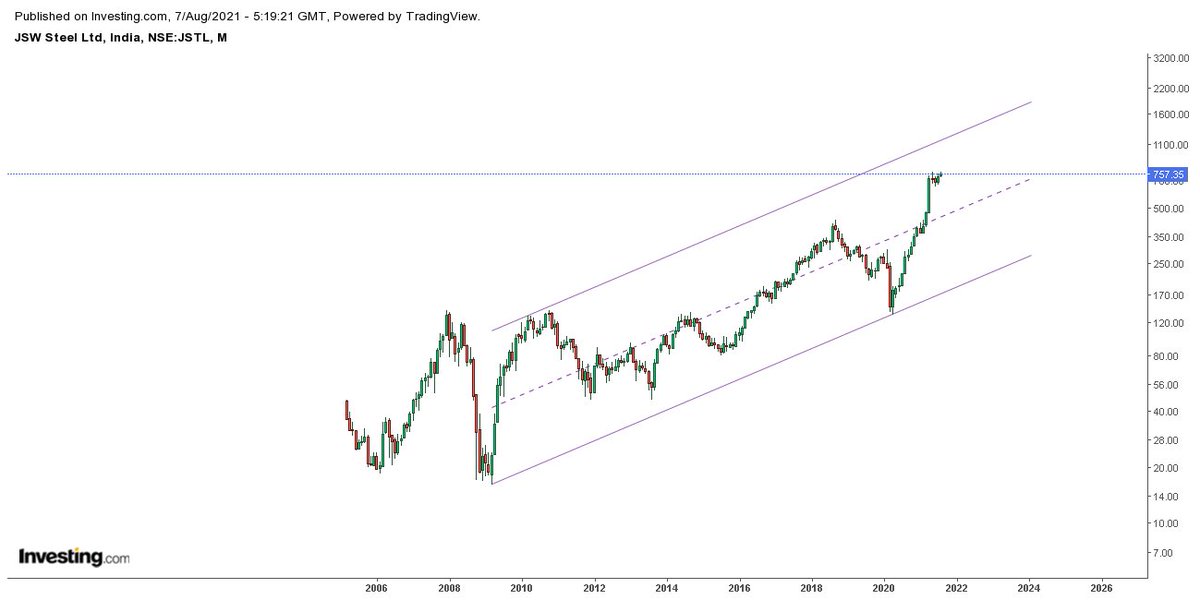


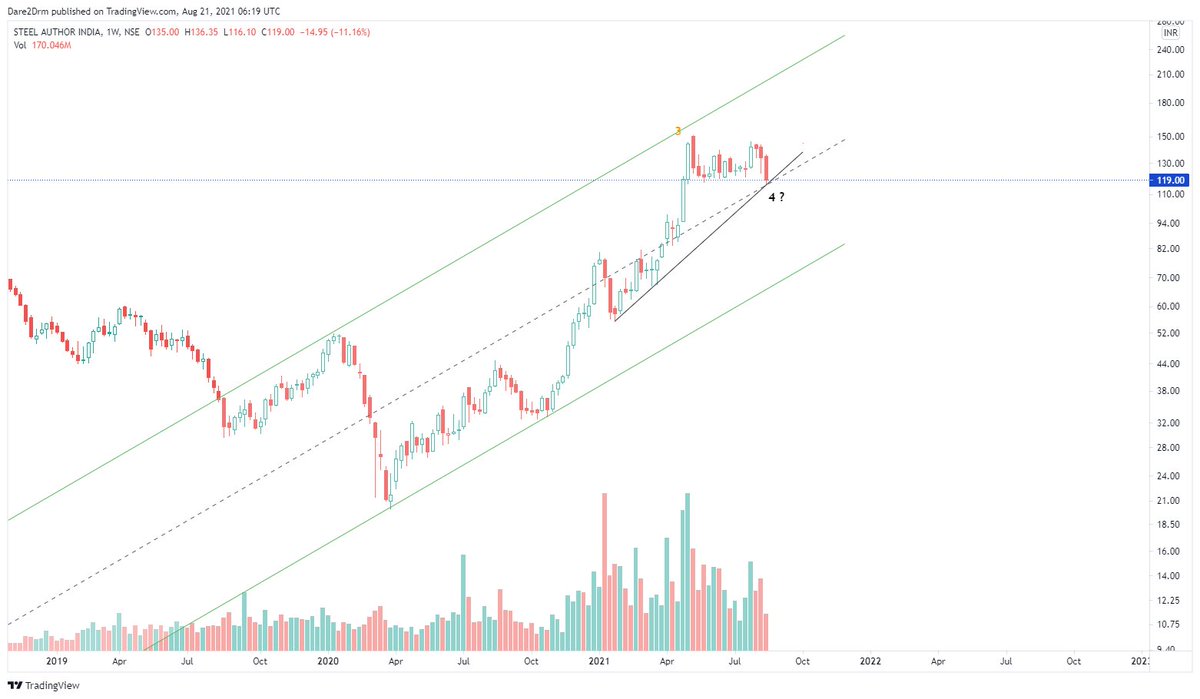
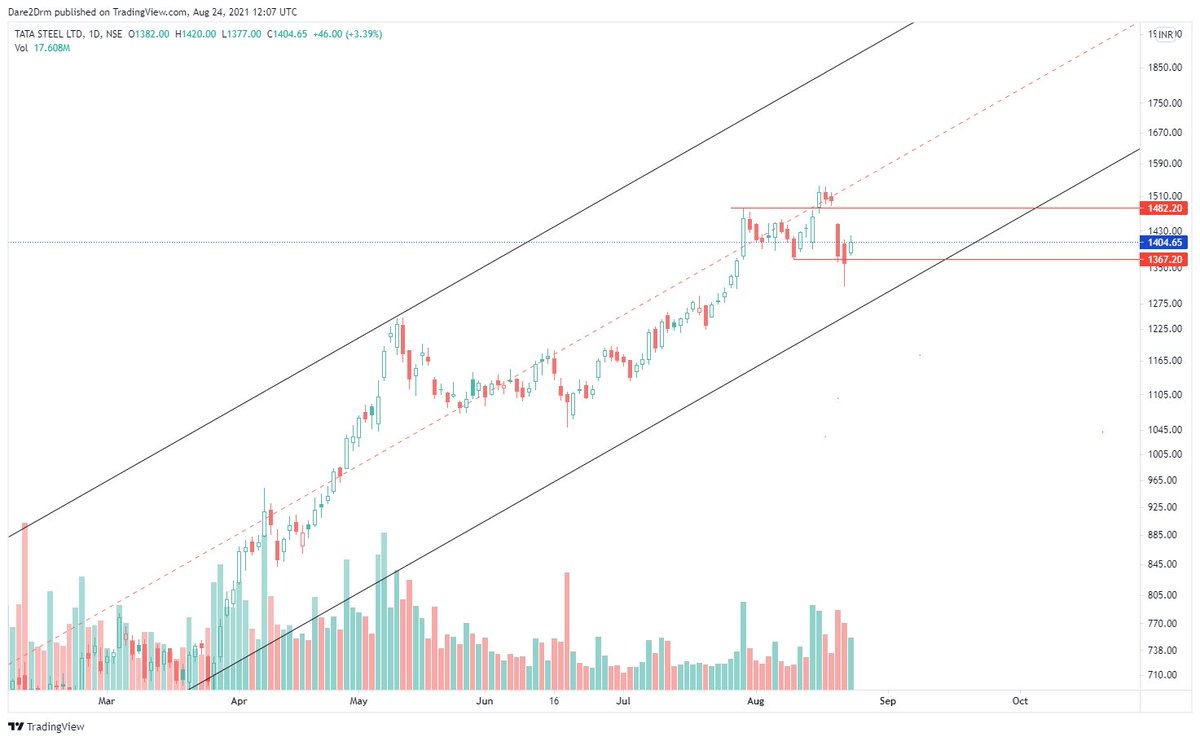
#Metals Expecting metals to do well from here. I am marking two levels, first one is bullish above, second one is a weekly closing stop for long trade. Posted about metals earlier as well, so just an update
#TataSteel 1483/1367 #JSWSteel 733/664 #SAIL 128/112 #Nalco 86/71 https://t.co/ENmCqITEmA
#Hindcopper 150/109 #Hindalco 450/399 #Vedl 307/260 #Hindustanzinc 345/293

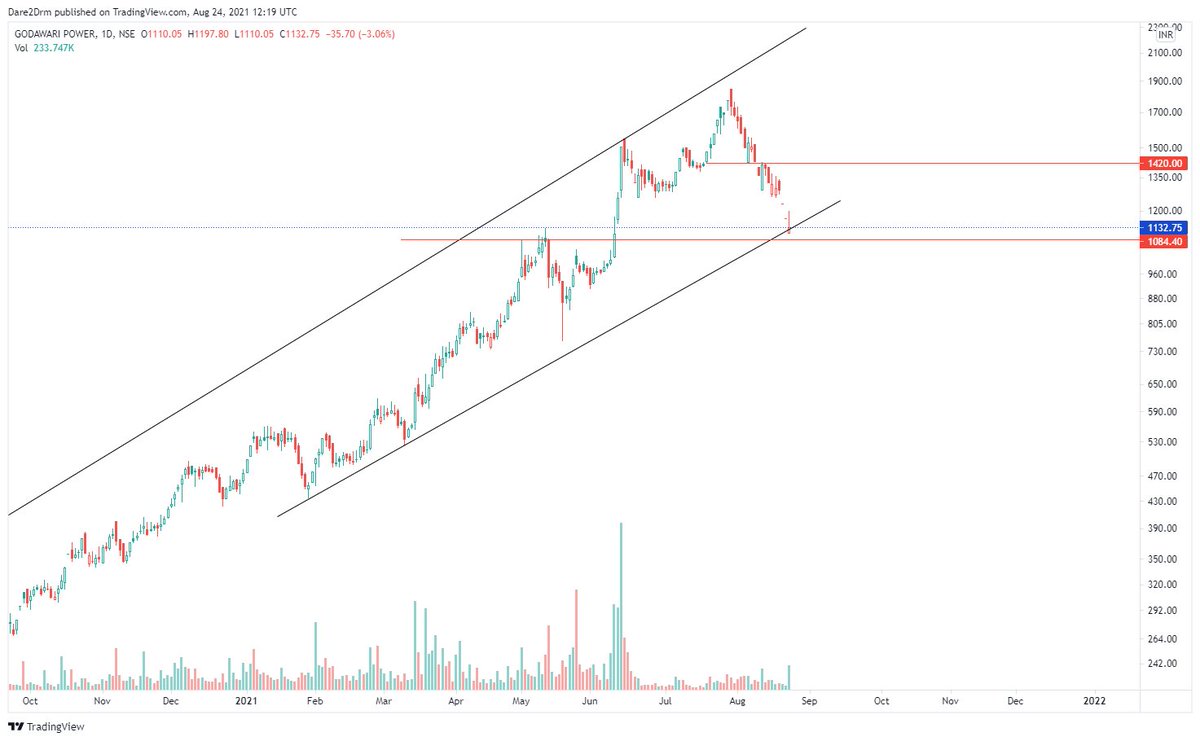
#GPIL 1420/1084 #Sardaenergy 747 / 614 #JindalPowerSteel 428/357
#TataSteel 1483/1367 #JSWSteel 733/664 #SAIL 128/112 #Nalco 86/71 https://t.co/ENmCqITEmA
Could be time to book out of large cap IT, if #Dxy continues to correct, fund flow could again chase risky assets #Banks #metals #midnsmall caps.
— Dare2Dream (@Dare2Dr10109801) August 23, 2021
Just my observation.
Below todays lows on small cap index could be game over for now. But looks like a ABC corrective done
#Hindcopper 150/109 #Hindalco 450/399 #Vedl 307/260 #Hindustanzinc 345/293
#GPIL 1420/1084 #Sardaenergy 747 / 614 #JindalPowerSteel 428/357