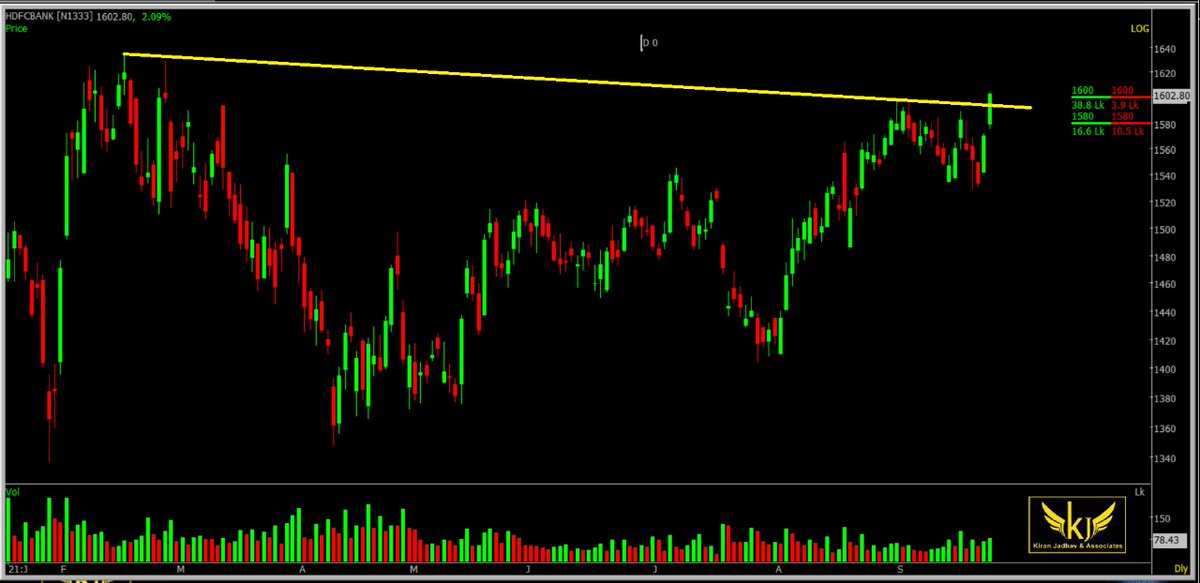
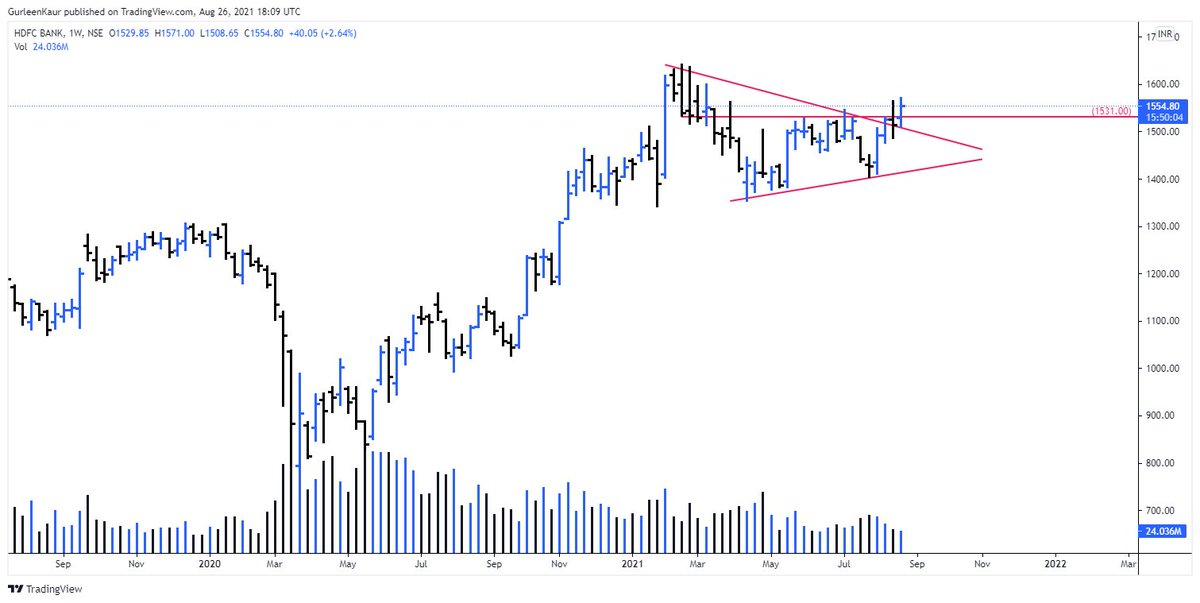
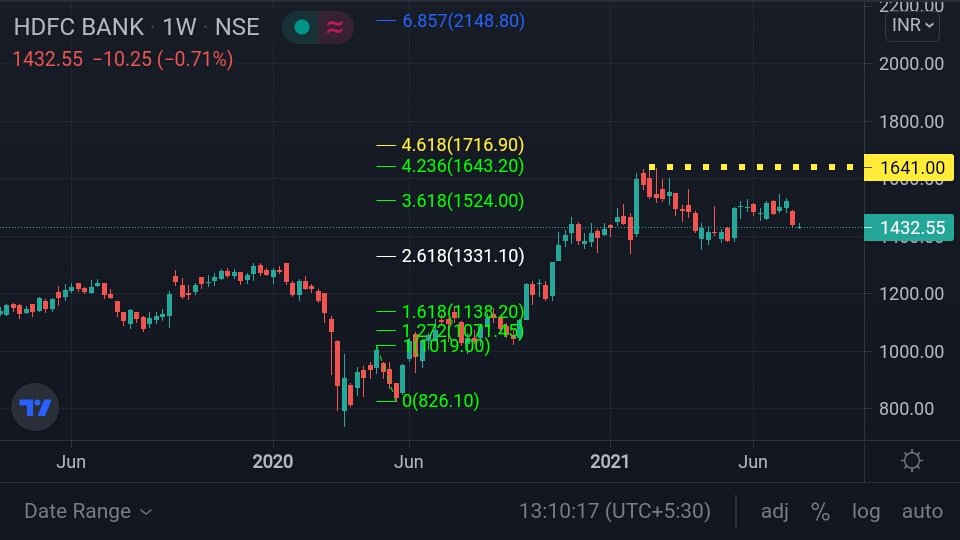
#HDFCBank
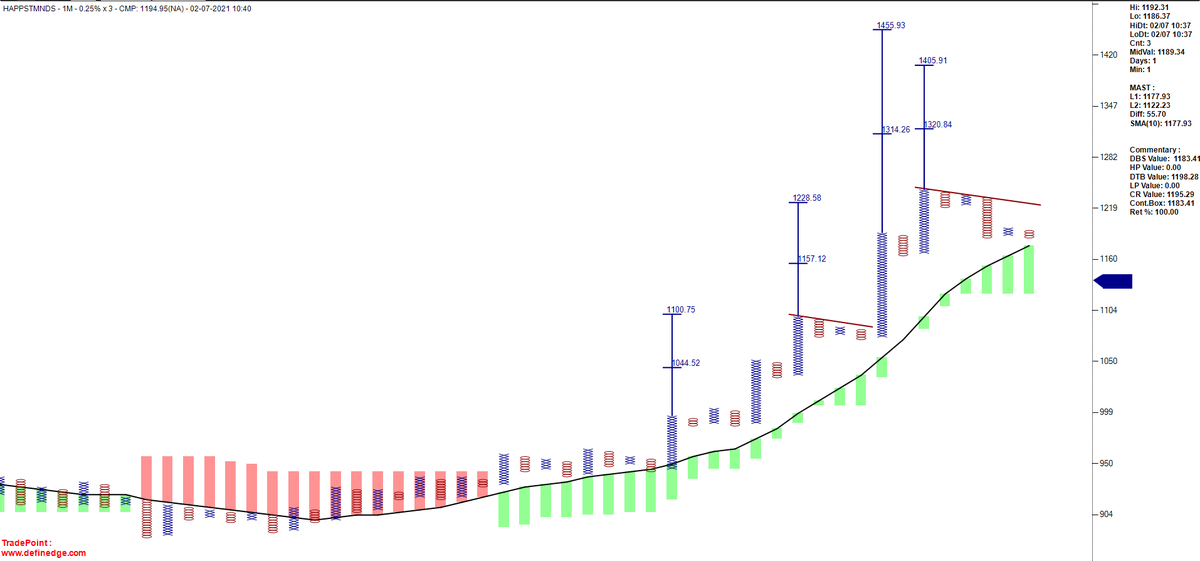
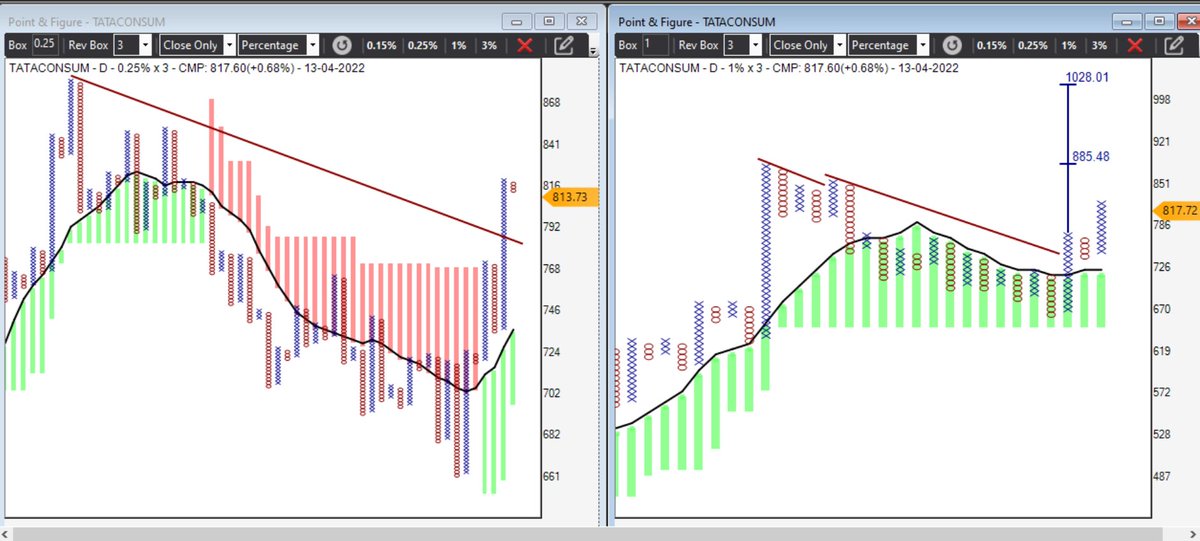
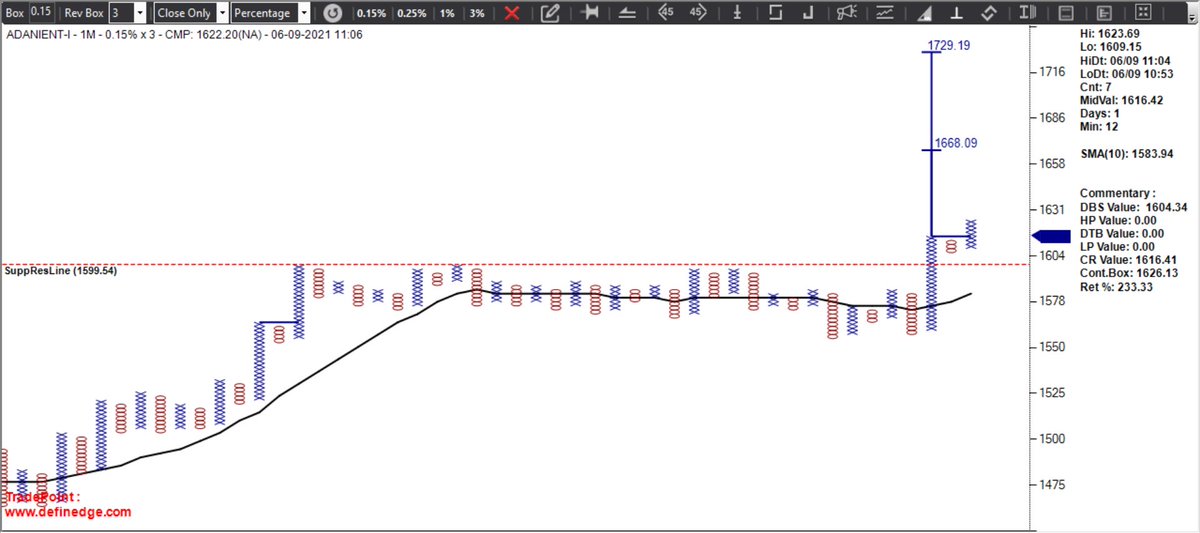
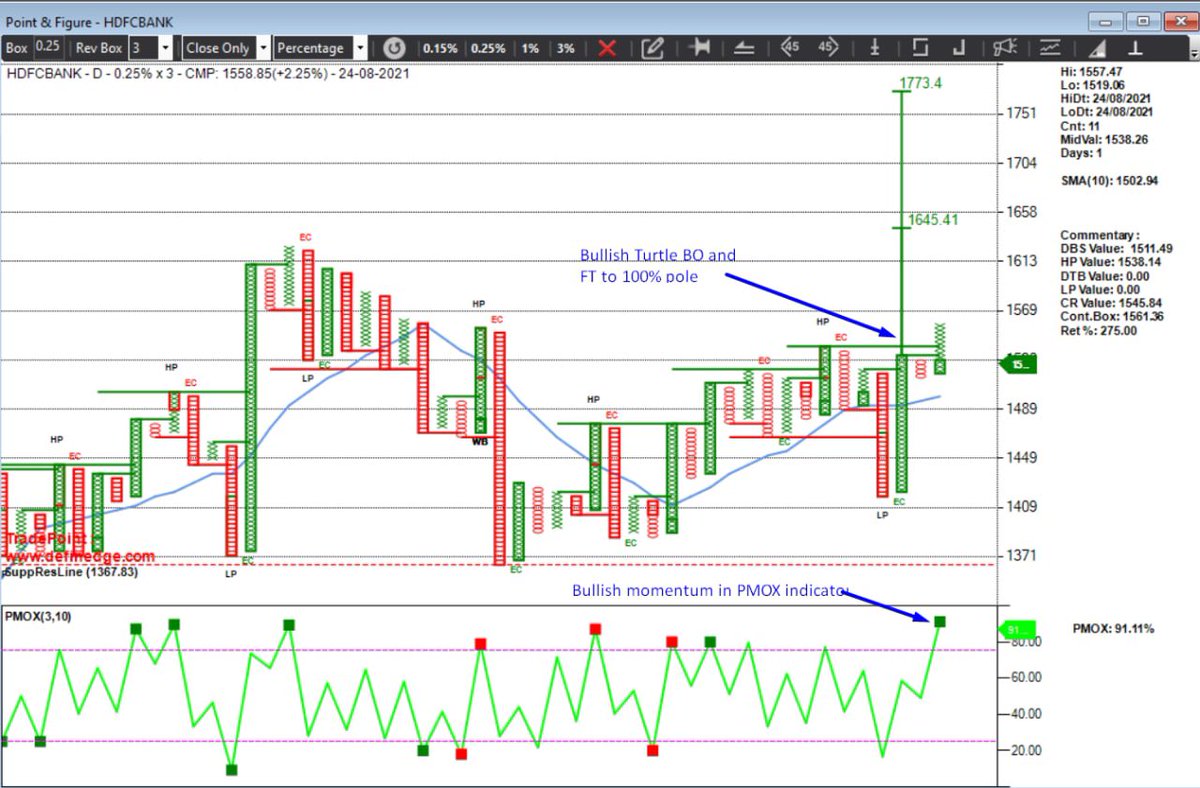
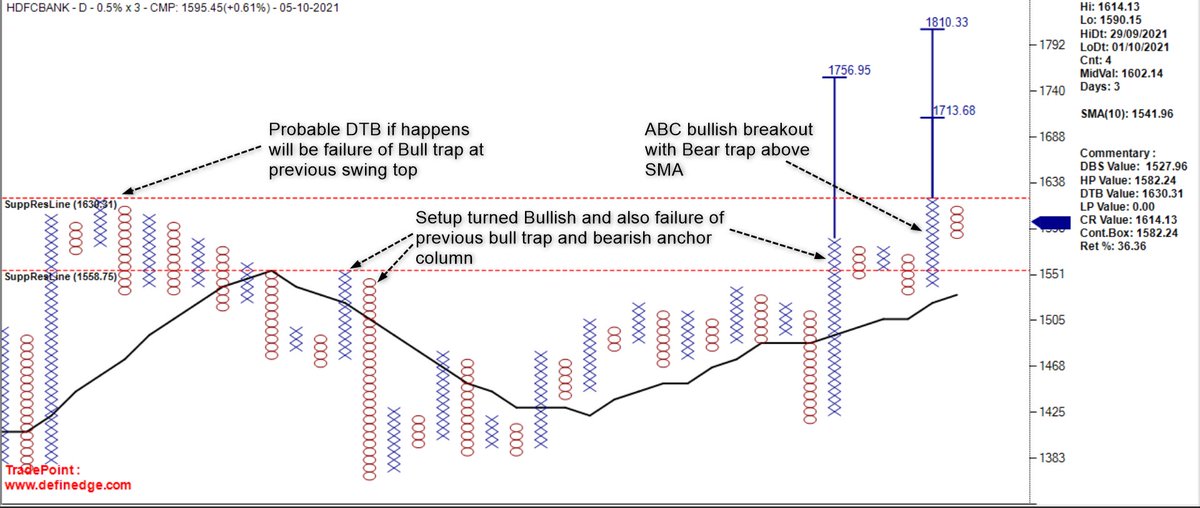
Probable Double Top Buy is associated with multiple bearish failures.
Bullish Breakouts associated with Bearish failures has an extra flavor of bullishness as there is an ingredient of failure of the other side
More from Vithal
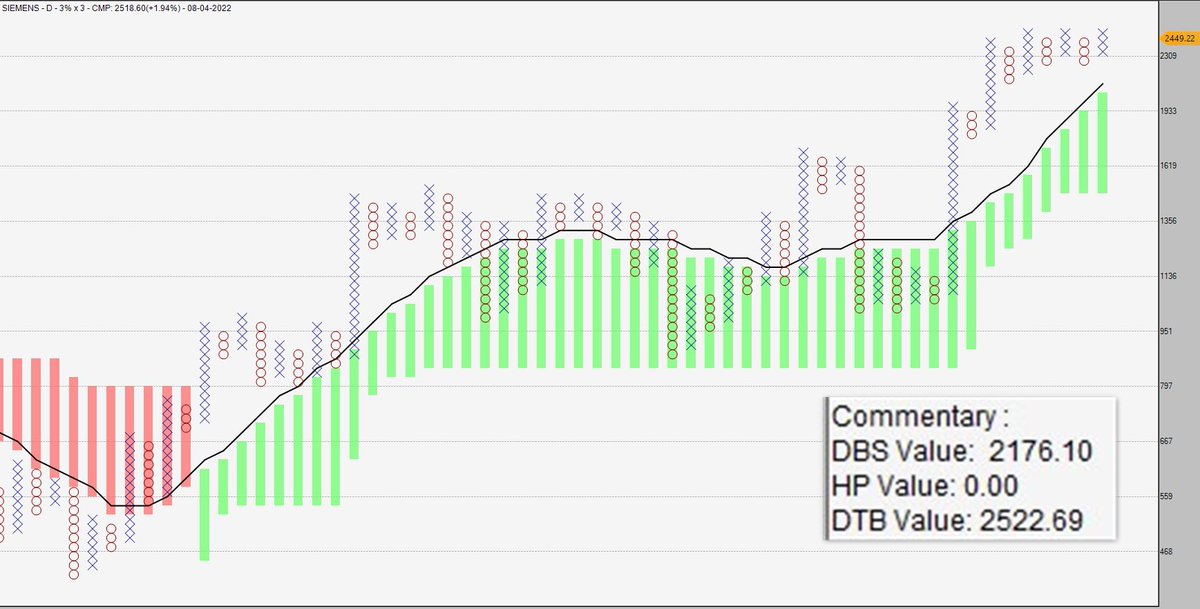
#AsianPaint Low Pole and later Double top buy above SMA after a bear trap. the earlier low pole and immediate DTB has negated the bearish anchor column. upside counts are active https://t.co/MvfHWK1IKx
#AsianPaint
— \U0001f1ee\U0001f1f3 \U0001d4d0\U0001d4f6\U0001d4f2\U0001d4fd \U0001d4e2\U0001d4ee\U0001d4fd\U0001d4f1 (@MaverickAmit01) May 23, 2022
Is it an Out of Box Idea \U0001f914 pic.twitter.com/Lg6m0AfVXB
More from Hdfcbank
You May Also Like
1/OK, data mystery time.
This New York Times feature shows China with a Gini Index of less than 30, which would make it more equal than Canada, France, or the Netherlands. https://t.co/g3Sv6DZTDE
That's weird. Income inequality in China is legendary.
Let's check this number.
2/The New York Times cites the World Bank's recent report, "Fair Progress? Economic Mobility across Generations Around the World".
The report is available here:
3/The World Bank report has a graph in which it appears to show the same value for China's Gini - under 0.3.
The graph cites the World Development Indicators as its source for the income inequality data.
4/The World Development Indicators are available at the World Bank's website.
Here's the Gini index: https://t.co/MvylQzpX6A
It looks as if the latest estimate for China's Gini is 42.2.
That estimate is from 2012.
5/A Gini of 42.2 would put China in the same neighborhood as the U.S., whose Gini was estimated at 41 in 2013.
I can't find the <30 number anywhere. The only other estimate in the tables for China is from 2008, when it was estimated at 42.8.
This New York Times feature shows China with a Gini Index of less than 30, which would make it more equal than Canada, France, or the Netherlands. https://t.co/g3Sv6DZTDE
That's weird. Income inequality in China is legendary.
Let's check this number.
2/The New York Times cites the World Bank's recent report, "Fair Progress? Economic Mobility across Generations Around the World".
The report is available here:
3/The World Bank report has a graph in which it appears to show the same value for China's Gini - under 0.3.
The graph cites the World Development Indicators as its source for the income inequality data.
4/The World Development Indicators are available at the World Bank's website.
Here's the Gini index: https://t.co/MvylQzpX6A
It looks as if the latest estimate for China's Gini is 42.2.
That estimate is from 2012.
5/A Gini of 42.2 would put China in the same neighborhood as the U.S., whose Gini was estimated at 41 in 2013.
I can't find the <30 number anywhere. The only other estimate in the tables for China is from 2008, when it was estimated at 42.8.