@BorisJohnson Government refused to heed that advice, U-turned predictably days before Xmas, causing chaos to people’s plans, with crowded scenes at train stations.
gaslighting dither & delay Government helped create conditions for the new covid strain to emerge
1/ When it became clear that schoolchildren were likely contributing significantly to the spread of the virus, his Government denied & issued legal threats to schools
@BorisJohnson Government refused to heed that advice, U-turned predictably days before Xmas, causing chaos to people’s plans, with crowded scenes at train stations.
Sadly, but very avoidably, this is exactly what @BorisJohnson Government has provided.
Through repeated negligent decisions and consistently late actions, @BorisJohnson Government has not only missed many opportunities to control the virus in the UK but actively worsened it.
https://t.co/0s1eddwJxH
https://t.co/0s1eddwJxH
- at which point our health services were at critical capacity & case levels were too high to be brought down sufficiently with a 4 week lockdown.
Despite the high number of cases at the end of lockdown, @BorisJohnson Govt went ahead & eased restrictions anyway.
This Govt is not short of money - it has spent billions on health measures & support for the economy.
Unrestricted by Parliament, the further powers conferred by the Coronavirus Act gives it complete freedom.
This failure is @BorisJohnson Government’s alone.
More from Government


Which metric is a better predictor of the severity of the fall surge in US states?
1) Margin of Democrat victory in Nov 2020 election
or
2) % infected through Sep 1, 2020
Can you guess which plot is which?

The left plot is based on the % infected through Sep 1, 2020. You can see that there is very little correlation with the % infected since Sep 1.
However, there is a *strong* correlation when using the margin of Biden's victory (right).
Infections % from https://t.co/WcXlfxv3Ah.

This is the strongest single variable I've seen in being able to explain the severity of this most recent wave in each state.
Not past infections / existing immunity, population density, racial makeup, latitude / weather / humidity, etc.
But political lean.
One can argue that states that lean Democrat are more likely to implement restrictions/mandates.
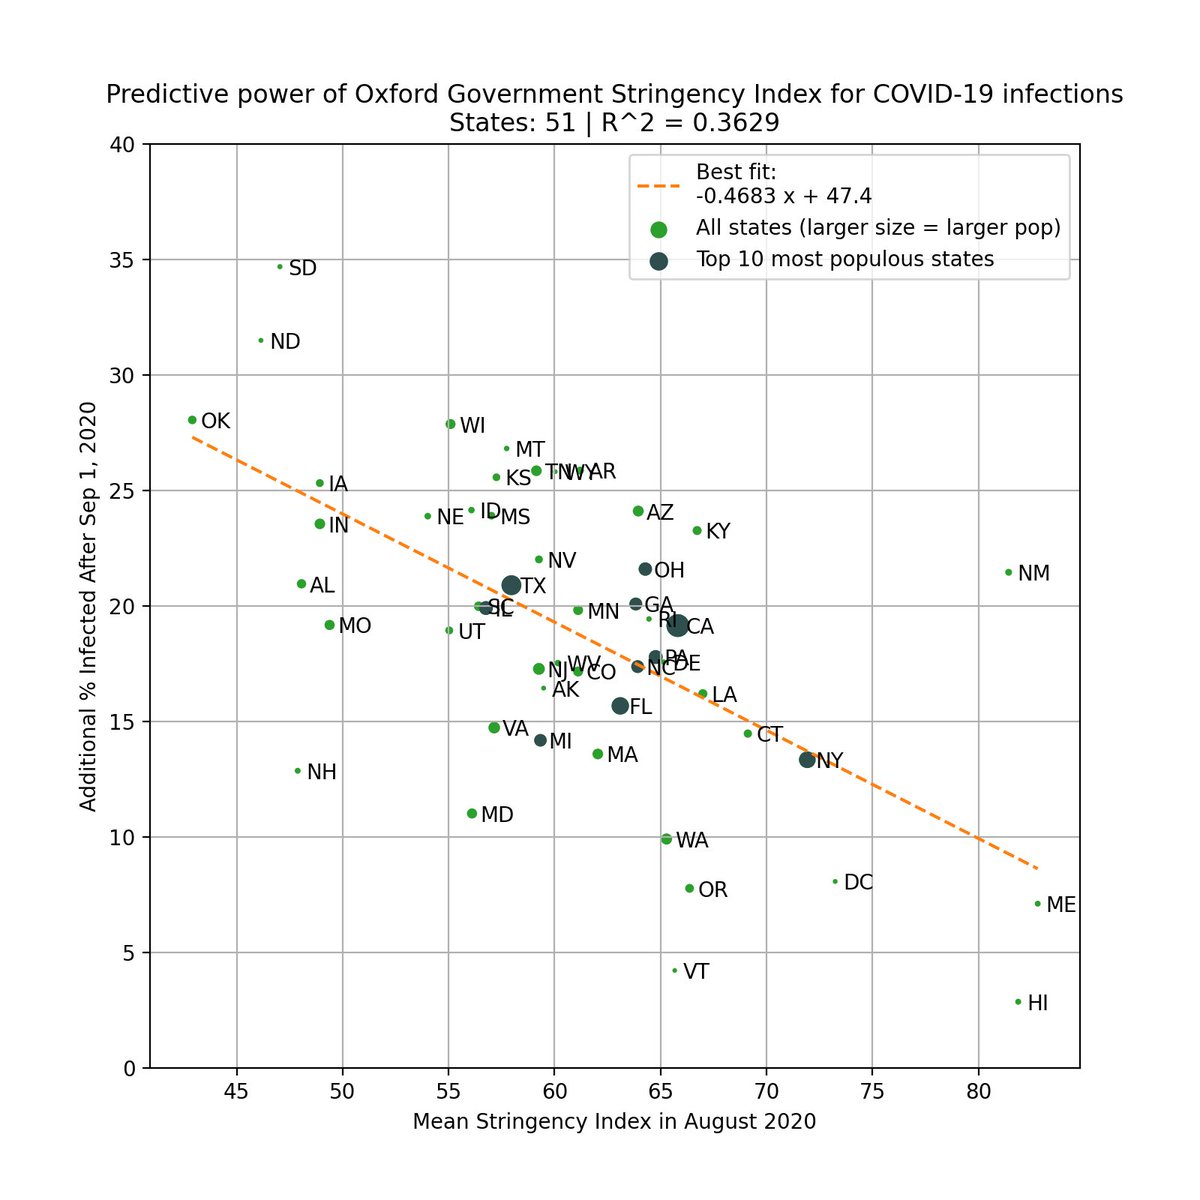
This is valid, so we test this by using the Government Stringency Index made by @UniofOxford.
We also see a correlation, but it's weaker (R^2=0.36 vs 0.50).
https://t.co/BxBBKwW6ta
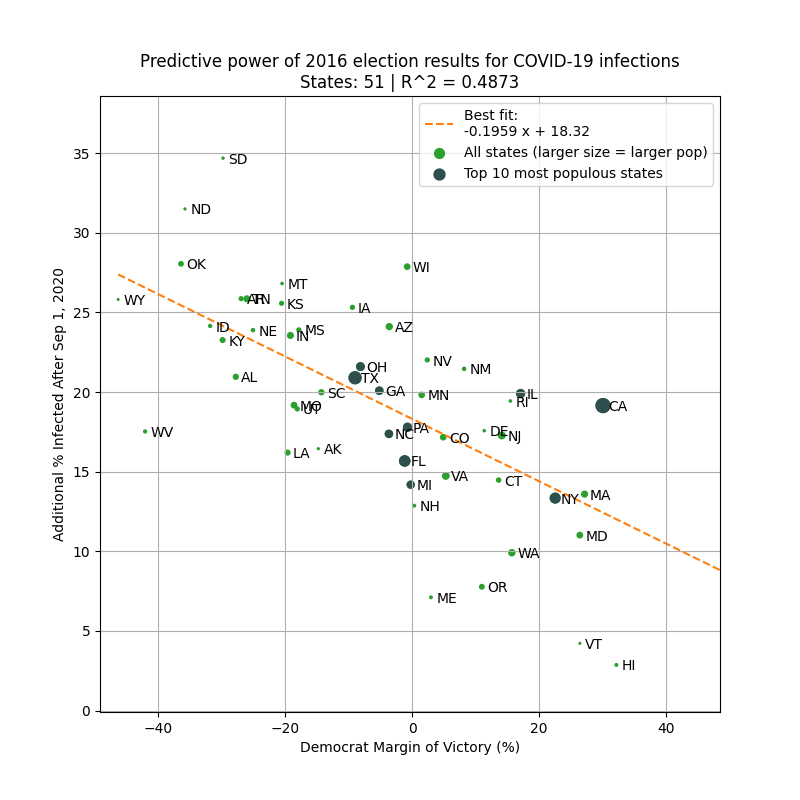
To avoid look-ahead bias/confounding variables, here is the same analysis but using 2016 margin of victory as the predictor. Similar results.
This basically says that 2016 election results is a better predictor of the severity of the fall wave than intervention levels in 2020!
1) Margin of Democrat victory in Nov 2020 election
or
2) % infected through Sep 1, 2020
Can you guess which plot is which?
The left plot is based on the % infected through Sep 1, 2020. You can see that there is very little correlation with the % infected since Sep 1.
However, there is a *strong* correlation when using the margin of Biden's victory (right).
Infections % from https://t.co/WcXlfxv3Ah.
This is the strongest single variable I've seen in being able to explain the severity of this most recent wave in each state.
Not past infections / existing immunity, population density, racial makeup, latitude / weather / humidity, etc.
But political lean.
One can argue that states that lean Democrat are more likely to implement restrictions/mandates.
This is valid, so we test this by using the Government Stringency Index made by @UniofOxford.
We also see a correlation, but it's weaker (R^2=0.36 vs 0.50).
https://t.co/BxBBKwW6ta
To avoid look-ahead bias/confounding variables, here is the same analysis but using 2016 margin of victory as the predictor. Similar results.
This basically says that 2016 election results is a better predictor of the severity of the fall wave than intervention levels in 2020!