1. Another thing that Progressives have to get back is the whole "This person is good vs. this person is bad" mindset. America is a white supremacist country, which inherently means even the most well meaning politicians will have to disappoint eventually. But a lot of
More from Government


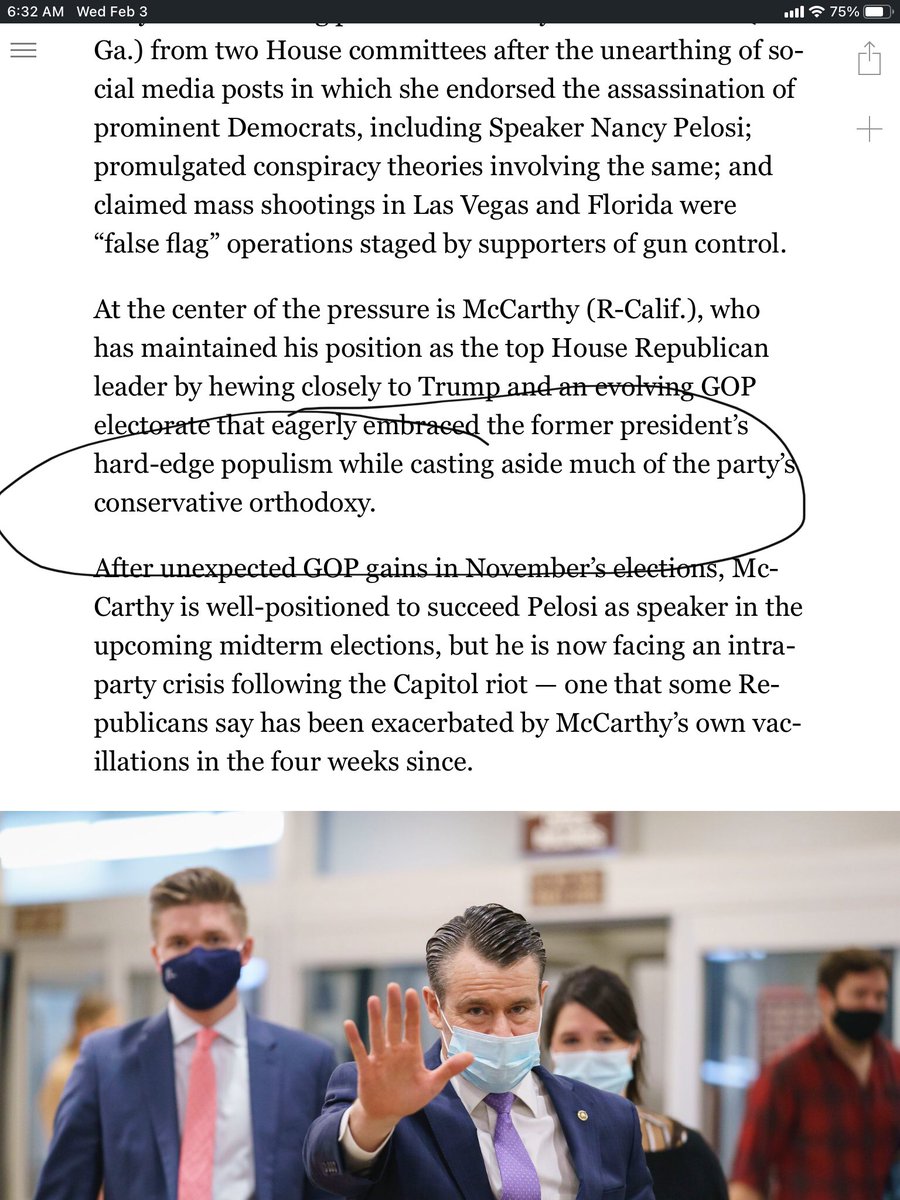
This is a good piece on fissures within the GOP but I think it mischaracterizes the Trump presidency as “populist” & repeats a story about how conservatives & the GOP expelled the far-right in the mid-1960s that is actually far more complicated. /1
I don’t think the sharp opposition between “hard-edge populism” & “conservative orthodoxy” holds. Many of the Trump administration’s achievements were boilerplate conservatism. Its own website trumpets things like “massive deregulation,” tax cuts, etc. /2
https://t.co/N97v85Bb79
The claim that Buckley and “key GOP politicians banded together to marginalize anti-Communist extremism and conspiracy-mongering” of the JBS has been widely repeated lately but the history is more complicated. /3
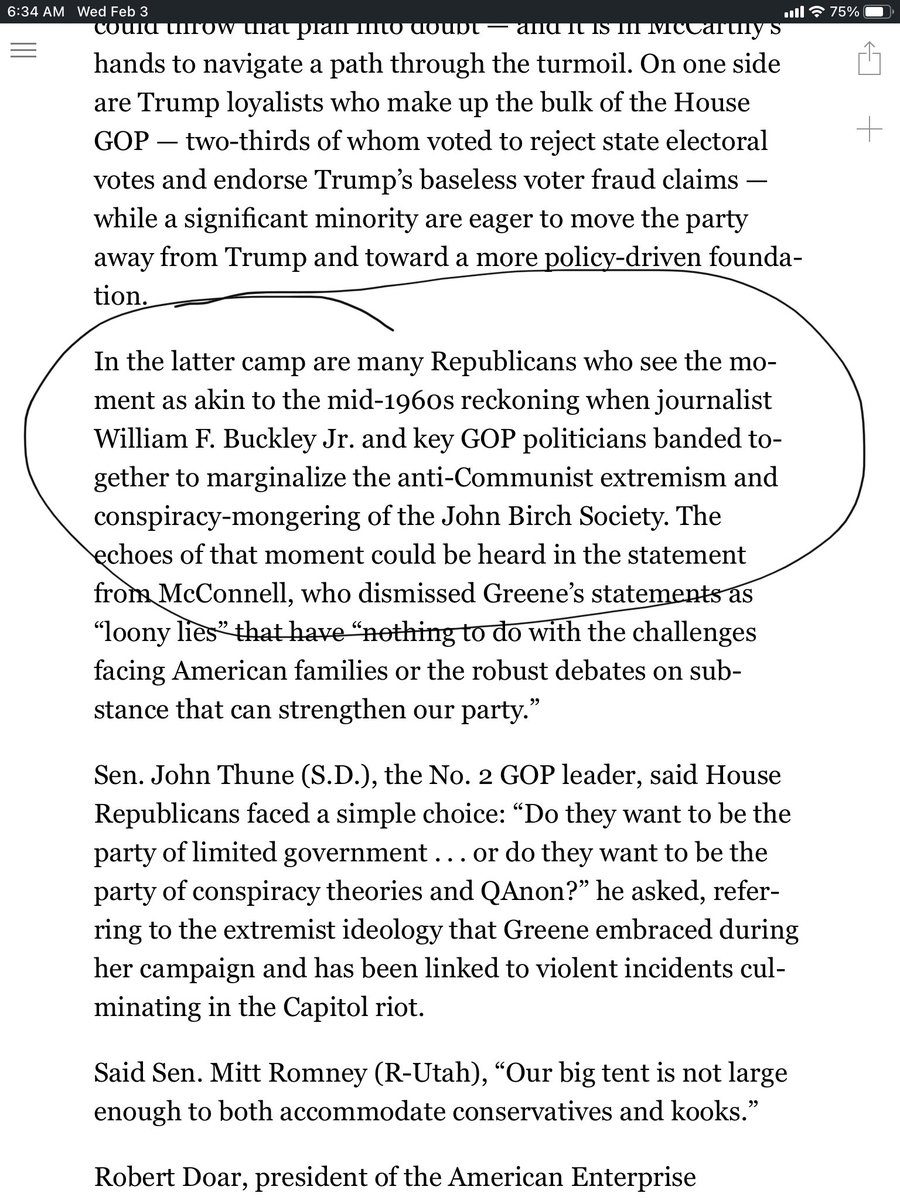
This tweet by @ThePlumLineGS citing a paper by @sam_rosenfeld and @daschloz on the "porous" boundary between conservatives, the GOP and the far-right is relevant in this context.
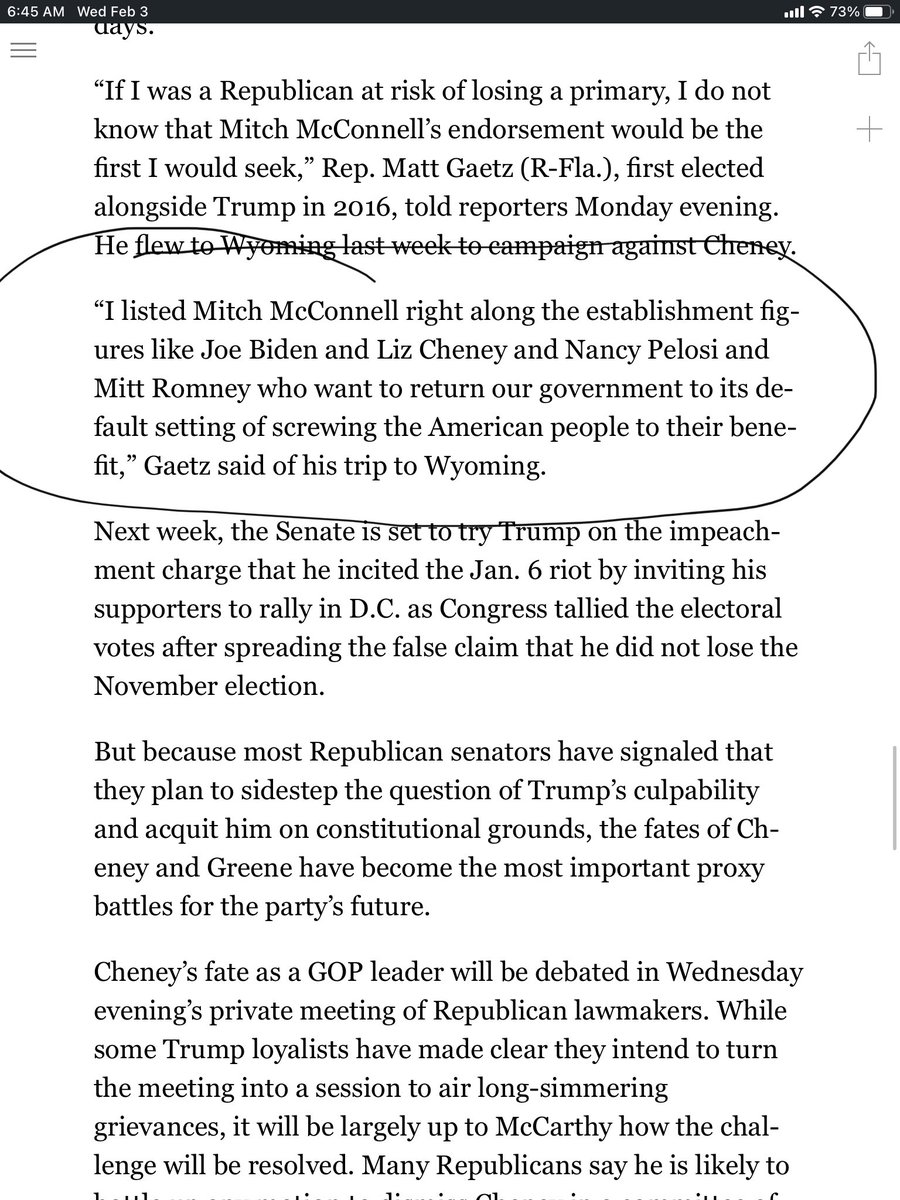
This is a separate point but I find it interesting that Gaetz, like Roy Moore did In his failed Senate campaign, disses McConnell. What are their actual policy differences? MM supported taking health care away from millions, a tax cut for the rich, conservative judges, etc. /5
I don’t think the sharp opposition between “hard-edge populism” & “conservative orthodoxy” holds. Many of the Trump administration’s achievements were boilerplate conservatism. Its own website trumpets things like “massive deregulation,” tax cuts, etc. /2
https://t.co/N97v85Bb79
The claim that Buckley and “key GOP politicians banded together to marginalize anti-Communist extremism and conspiracy-mongering” of the JBS has been widely repeated lately but the history is more complicated. /3
This tweet by @ThePlumLineGS citing a paper by @sam_rosenfeld and @daschloz on the "porous" boundary between conservatives, the GOP and the far-right is relevant in this context.
There's a great paper called "The Long New Right" that tells the story of the GOP/conservative movement's failure to police extremists for the last 50 years.
— Greg Sargent (@ThePlumLineGS) January 28, 2021
It's highly relevant to the insurrection and Marjorie Greene's lunacy.
I summed it up here:https://t.co/DTlzGomy5h pic.twitter.com/Dhc38CDuE2
This is a separate point but I find it interesting that Gaetz, like Roy Moore did In his failed Senate campaign, disses McConnell. What are their actual policy differences? MM supported taking health care away from millions, a tax cut for the rich, conservative judges, etc. /5

Which metric is a better predictor of the severity of the fall surge in US states?
1) Margin of Democrat victory in Nov 2020 election
or
2) % infected through Sep 1, 2020
Can you guess which plot is which?

The left plot is based on the % infected through Sep 1, 2020. You can see that there is very little correlation with the % infected since Sep 1.
However, there is a *strong* correlation when using the margin of Biden's victory (right).
Infections % from https://t.co/WcXlfxv3Ah.

This is the strongest single variable I've seen in being able to explain the severity of this most recent wave in each state.
Not past infections / existing immunity, population density, racial makeup, latitude / weather / humidity, etc.
But political lean.
One can argue that states that lean Democrat are more likely to implement restrictions/mandates.
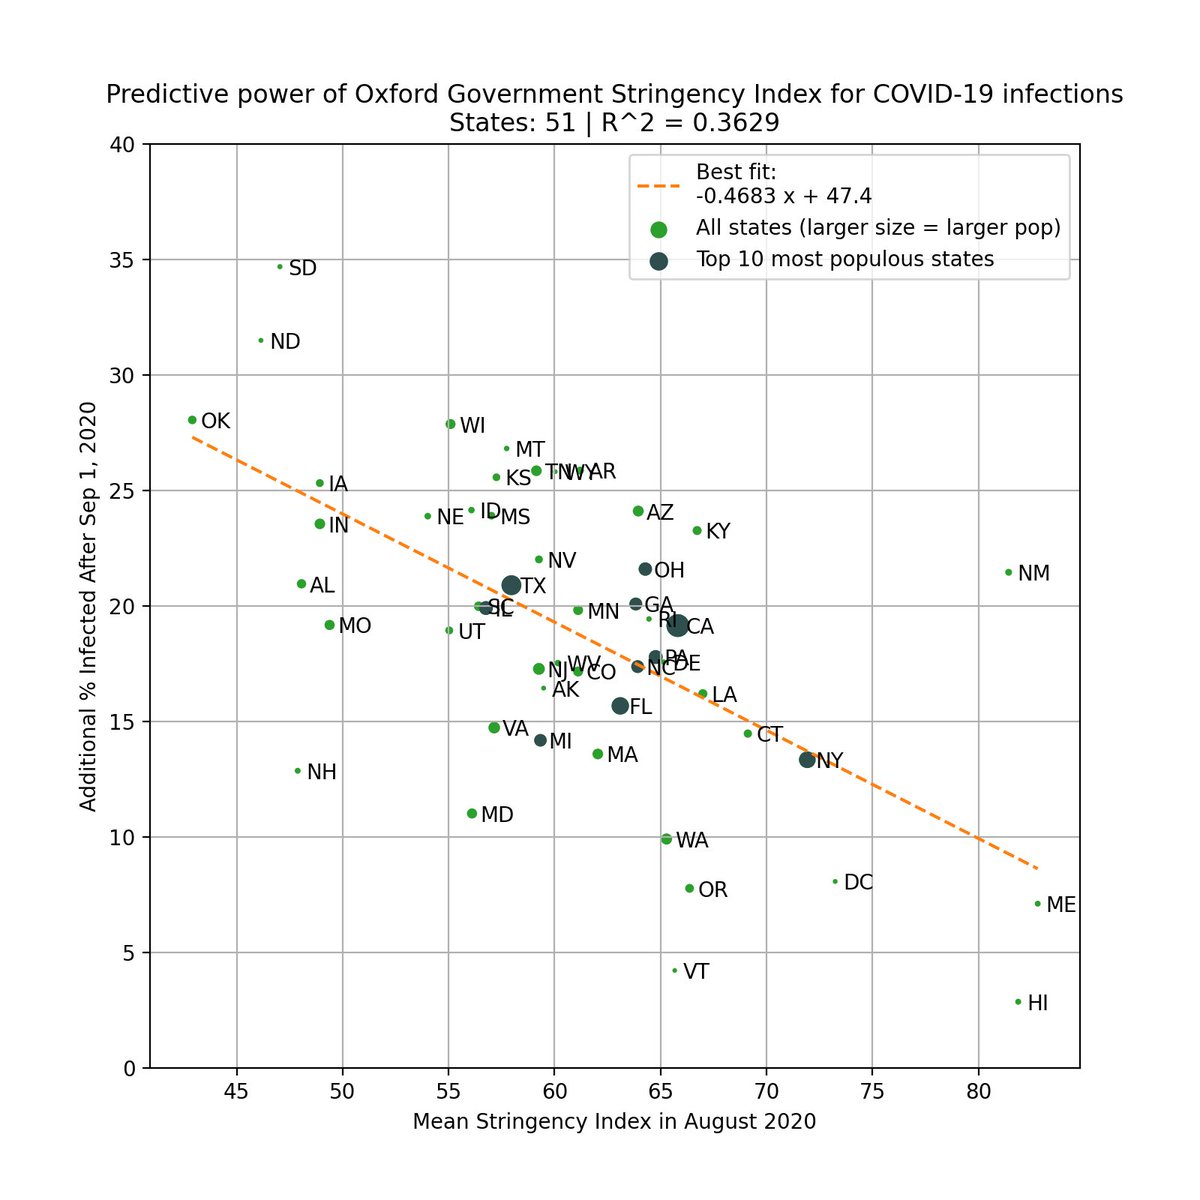
This is valid, so we test this by using the Government Stringency Index made by @UniofOxford.
We also see a correlation, but it's weaker (R^2=0.36 vs 0.50).
https://t.co/BxBBKwW6ta
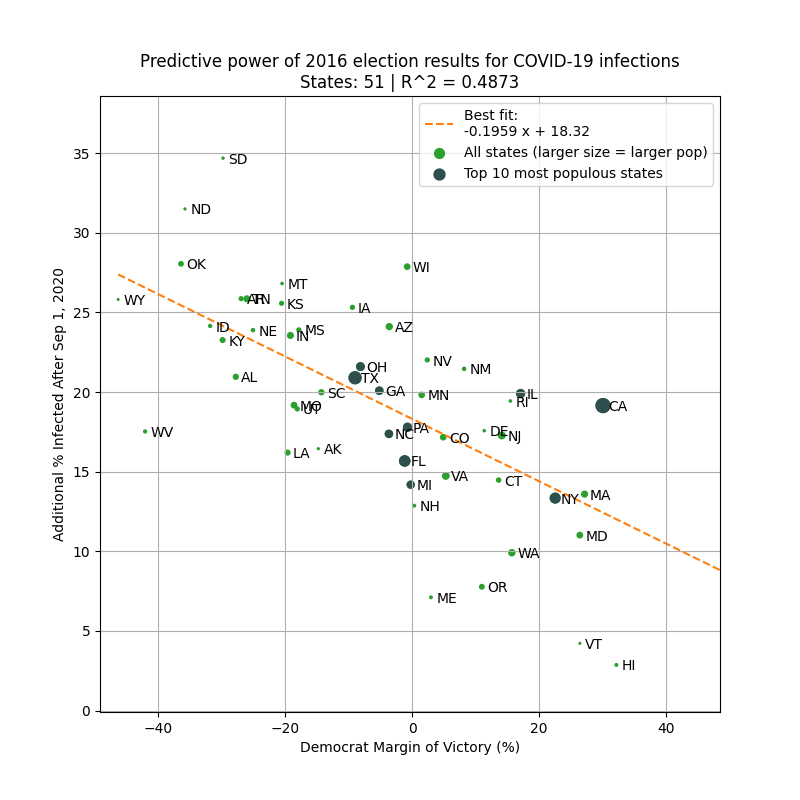
To avoid look-ahead bias/confounding variables, here is the same analysis but using 2016 margin of victory as the predictor. Similar results.
This basically says that 2016 election results is a better predictor of the severity of the fall wave than intervention levels in 2020!
1) Margin of Democrat victory in Nov 2020 election
or
2) % infected through Sep 1, 2020
Can you guess which plot is which?
The left plot is based on the % infected through Sep 1, 2020. You can see that there is very little correlation with the % infected since Sep 1.
However, there is a *strong* correlation when using the margin of Biden's victory (right).
Infections % from https://t.co/WcXlfxv3Ah.
This is the strongest single variable I've seen in being able to explain the severity of this most recent wave in each state.
Not past infections / existing immunity, population density, racial makeup, latitude / weather / humidity, etc.
But political lean.
One can argue that states that lean Democrat are more likely to implement restrictions/mandates.
This is valid, so we test this by using the Government Stringency Index made by @UniofOxford.
We also see a correlation, but it's weaker (R^2=0.36 vs 0.50).
https://t.co/BxBBKwW6ta
To avoid look-ahead bias/confounding variables, here is the same analysis but using 2016 margin of victory as the predictor. Similar results.
This basically says that 2016 election results is a better predictor of the severity of the fall wave than intervention levels in 2020!