I asked will your Ibadan radio station host 100 Eso's? SILENCE!
Interesting parapo meeting today, anger, lots of 'THEY' vs 'US'. The zoom meeting was well attended. People threatening fire, thunder, tagging those of us calling for calm "Traitors".
Then I asked, how many of your children were involved in the Ibadan killings today? SILENCE!
I asked will your Ibadan radio station host 100 Eso's? SILENCE!
That one pretended he had poor network. No answer!
It is not too late to look back at the mistake of the past to correct the wrongs of today. The choice is for us all.
If this is the only favour I will get from supporting you, please. DO BETTER! Declare a war on all criminal elements with AK47.
I wont be the one to bust the myth. I recognise that the emergence of Sunday speaks volume of our collective failure.
All I can say is if it gets too hot. Sunday will join is family in Germany.
I KNOW IT!

More from Government

Canada is failing to act on Climate Change. @wef @WorldBank @IMFNews @IPCC_CH @UNDPGAIN @AntiCorruptIntl @Pontifex @JustinWelby @OCCRP @StopCorpAbuse @TaxJusticeNet @FairTaxCanada @ecojustice_ca @WCELaw @CanEnvLawAssn @envirodefence @IBA_Canada #cdnpoli
Covid recovery money is going to the oligarchy.
Ottawa and the provinces have put very little on the table to help clean-tech companies directly during Covid 19 while targeting fossil-fuel producers with more than $16 billion in aid.
Coast to coast people have demanded treaties be honored. We demanded climate action, divestment and land back but Canada is not listening. This video shows 10 years of rallies in Waterloo Ontario. City & regional council declared a climate emergency. 🚨
The Bank of China (BOC), SNC-Lavalin and WE Charity were recipients of taxpayer-funded the Covid 19 Canadian Emergency Wage Subsidy (CEWS)
Canada: Falling Far Short On Climate Policy, Emissions Reduction and Energy Transition #cdnpoli #bcpoli #alpolitics #onpoli @JimHarris @MikeHudema @SethDKlein @ElizabethMay @CitizensLobbyCa @lulex @kainagata https://t.co/jhm1TXvAKN pic.twitter.com/yEPINC5PTr
— Below2\xb0C (@Below2C_) December 29, 2020
Covid recovery money is going to the oligarchy.
Ottawa and the provinces have put very little on the table to help clean-tech companies directly during Covid 19 while targeting fossil-fuel producers with more than $16 billion in aid.
Coast to coast people have demanded treaties be honored. We demanded climate action, divestment and land back but Canada is not listening. This video shows 10 years of rallies in Waterloo Ontario. City & regional council declared a climate emergency. 🚨
The Bank of China (BOC), SNC-Lavalin and WE Charity were recipients of taxpayer-funded the Covid 19 Canadian Emergency Wage Subsidy (CEWS)


Which metric is a better predictor of the severity of the fall surge in US states?
1) Margin of Democrat victory in Nov 2020 election
or
2) % infected through Sep 1, 2020
Can you guess which plot is which?

The left plot is based on the % infected through Sep 1, 2020. You can see that there is very little correlation with the % infected since Sep 1.
However, there is a *strong* correlation when using the margin of Biden's victory (right).
Infections % from https://t.co/WcXlfxv3Ah.

This is the strongest single variable I've seen in being able to explain the severity of this most recent wave in each state.
Not past infections / existing immunity, population density, racial makeup, latitude / weather / humidity, etc.
But political lean.
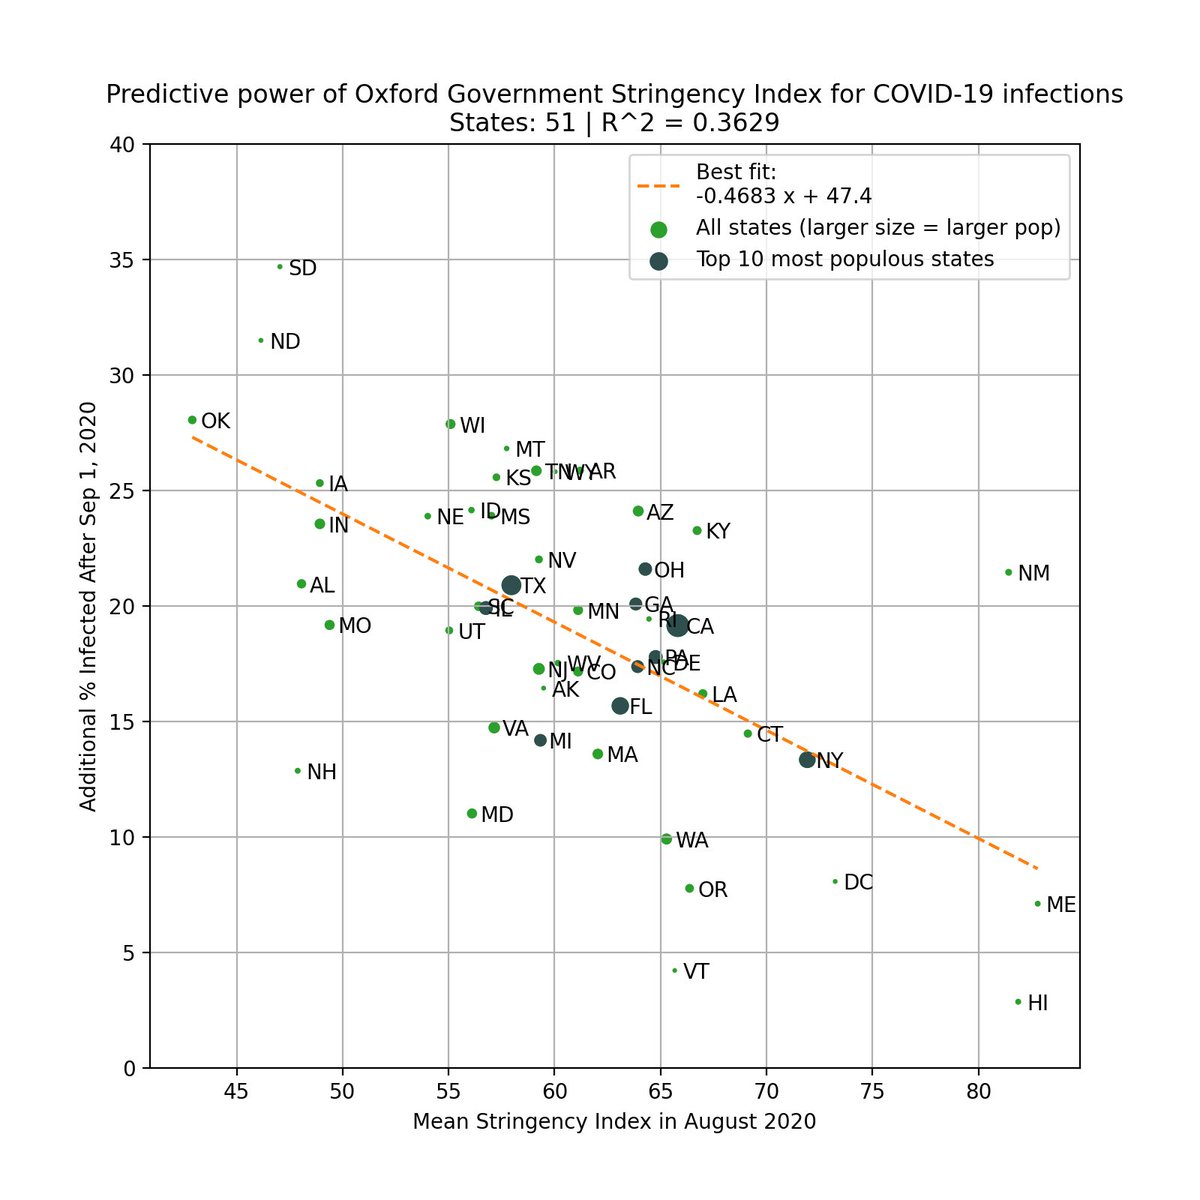
One can argue that states that lean Democrat are more likely to implement restrictions/mandates.
This is valid, so we test this by using the Government Stringency Index made by @UniofOxford.
We also see a correlation, but it's weaker (R^2=0.36 vs 0.50).
https://t.co/BxBBKwW6ta
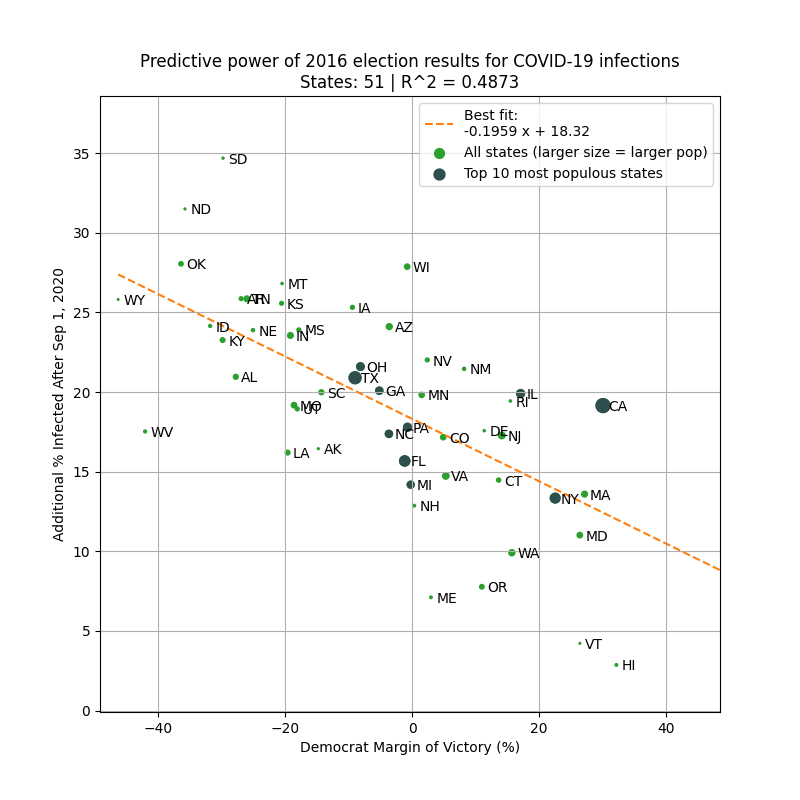
To avoid look-ahead bias/confounding variables, here is the same analysis but using 2016 margin of victory as the predictor. Similar results.
This basically says that 2016 election results is a better predictor of the severity of the fall wave than intervention levels in 2020!
1) Margin of Democrat victory in Nov 2020 election
or
2) % infected through Sep 1, 2020
Can you guess which plot is which?
The left plot is based on the % infected through Sep 1, 2020. You can see that there is very little correlation with the % infected since Sep 1.
However, there is a *strong* correlation when using the margin of Biden's victory (right).
Infections % from https://t.co/WcXlfxv3Ah.
This is the strongest single variable I've seen in being able to explain the severity of this most recent wave in each state.
Not past infections / existing immunity, population density, racial makeup, latitude / weather / humidity, etc.
But political lean.
One can argue that states that lean Democrat are more likely to implement restrictions/mandates.
This is valid, so we test this by using the Government Stringency Index made by @UniofOxford.
We also see a correlation, but it's weaker (R^2=0.36 vs 0.50).
https://t.co/BxBBKwW6ta
To avoid look-ahead bias/confounding variables, here is the same analysis but using 2016 margin of victory as the predictor. Similar results.
This basically says that 2016 election results is a better predictor of the severity of the fall wave than intervention levels in 2020!