By the time the #Fed finally admits that higher #inflation is not transitory it will be much too high for the Fed to actually do anything to prevent it from getting even worse. When investors finally figure this out the U.S. dollar and Treasuries will crash and #gold will soar.
More from Gold

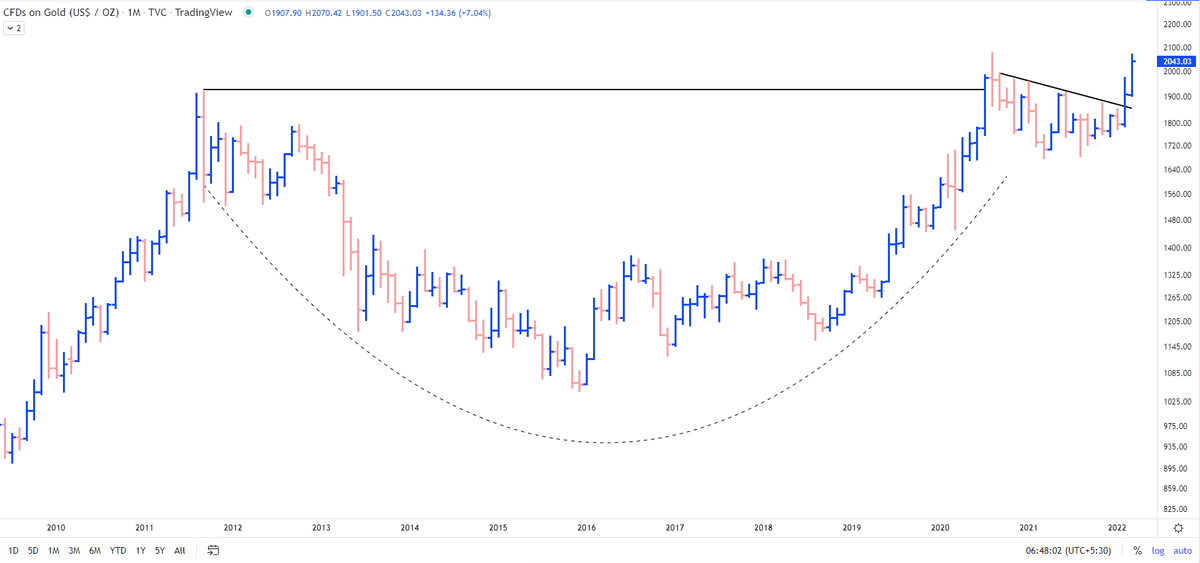
What my simple analysis showed was the decadal breakout in making in #Gold along with the outperformance over S&P500 #SPX
Result?
1850$ to 2070$
Updated chart https://t.co/l6pEGD7r6D
Result?
1850$ to 2070$
Updated chart https://t.co/l6pEGD7r6D
Most interesting chart:
— The_Chartist \U0001f4c8 (@charts_zone) February 12, 2022
Orange line = Gold
Blue Curve = Gold/S&P 500
Previously the ratio crossed 50 days MA in Feb' 20 with Gold giving a breakout on the charts. The previous cross of 50 days MA didn't result in gold breaking out. pic.twitter.com/HRG1fvsILp

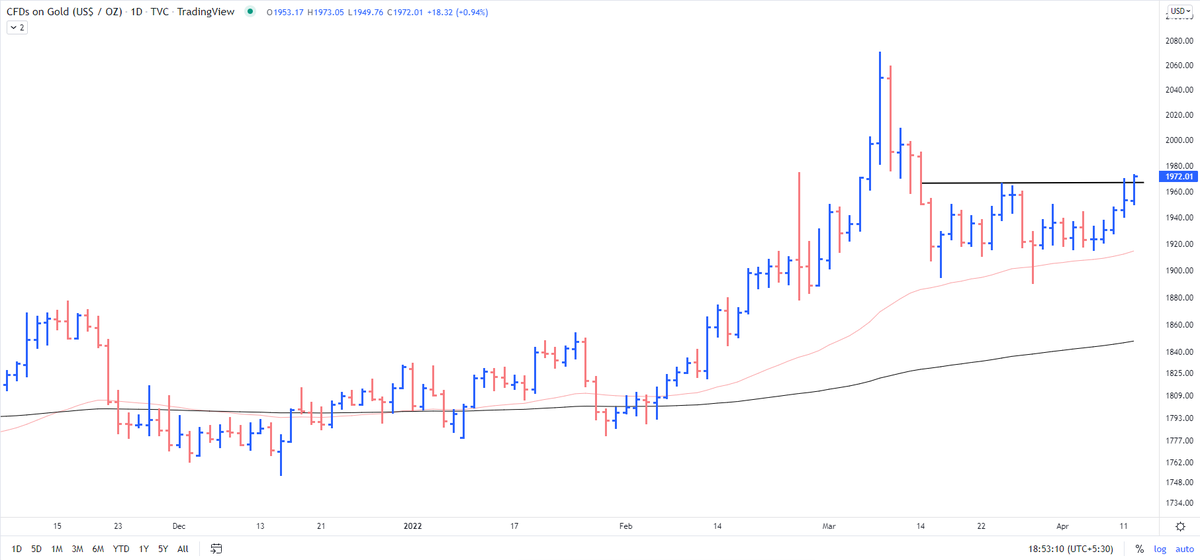
Fast forward to today when I added Gold at 1850. It made a sharp-up move but didn't want to sell for the sake of hedging. The positions were scaled up around 1925 with the fresh SL of 1900.
So far doing good. 2000 is the level I would be looking for. https://t.co/j1kiKRSx0y
So far doing good. 2000 is the level I would be looking for. https://t.co/j1kiKRSx0y
GOLD - 1 9 2 7 from 1 8 5 0
— The_Chartist \U0001f4c8 (@charts_zone) February 24, 2022
No indicators, nothing. Understand the language of the price. https://t.co/l6pEGD7r6D pic.twitter.com/JWZjlTLSBF