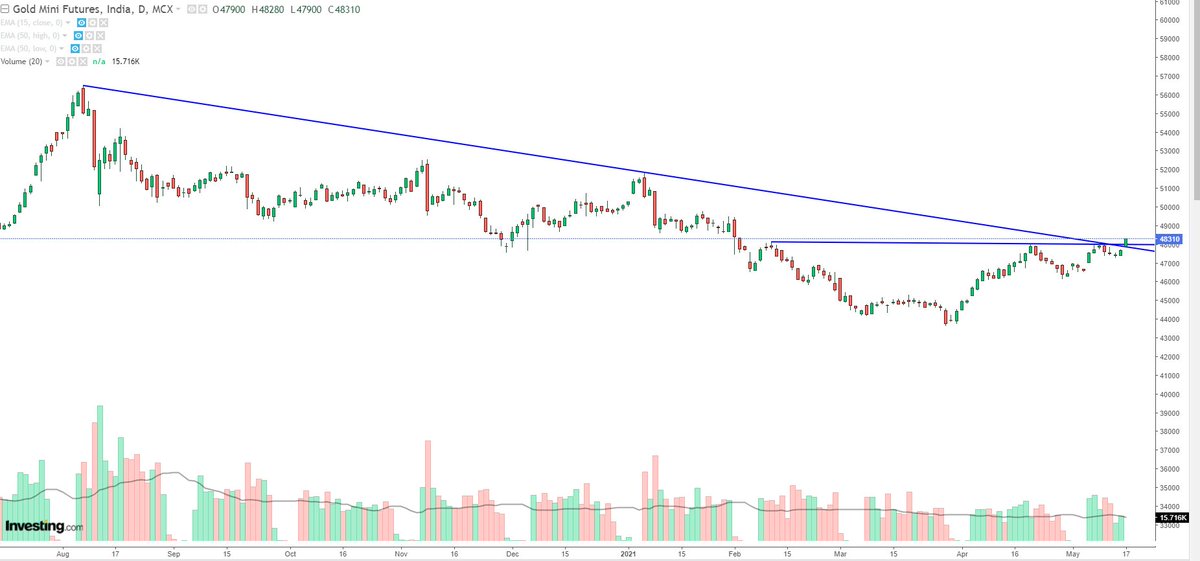
#Gold - Updated Chart
#KeepISimple #TechnicalAnalysis #charting
https://t.co/rhZEVYMw8q

#Gold - Q22021 can be Gold's Qtr#COMEX #Gold #Trendline #Channel #100EMA #Timecycle #Hammer #bullish $GC $1725 https://t.co/dapJWFElMs pic.twitter.com/NTz6DNkJyI
— Brijesh (@bbrijesh) April 5, 2021
More from Gold

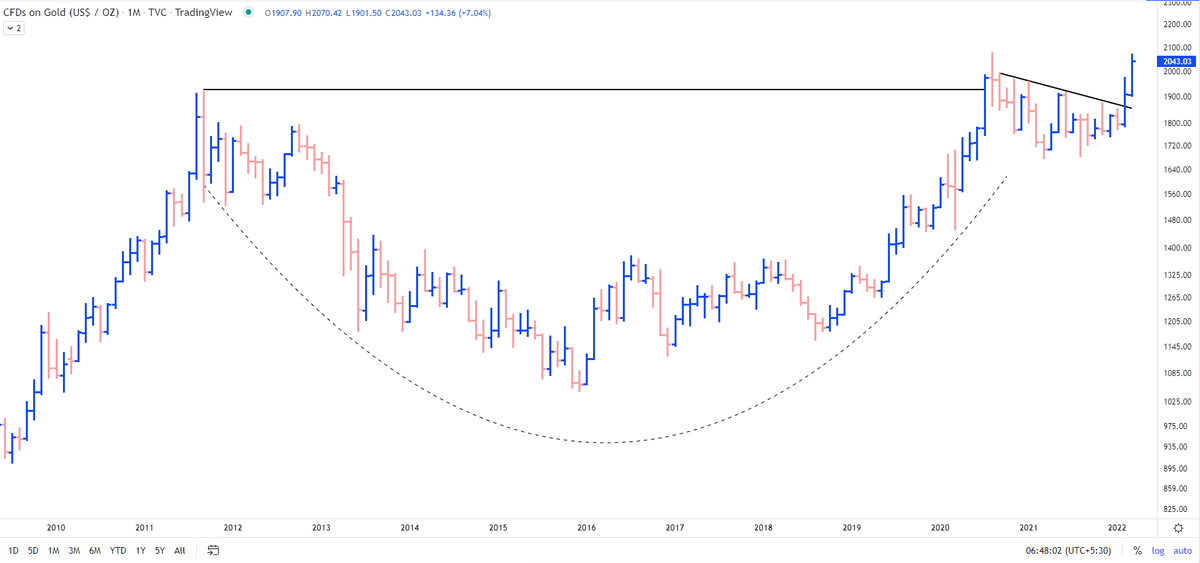
What my simple analysis showed was the decadal breakout in making in #Gold along with the outperformance over S&P500 #SPX
Result?
1850$ to 2070$
Updated chart https://t.co/l6pEGD7r6D
Result?
1850$ to 2070$
Updated chart https://t.co/l6pEGD7r6D
Most interesting chart:
— The_Chartist \U0001f4c8 (@charts_zone) February 12, 2022
Orange line = Gold
Blue Curve = Gold/S&P 500
Previously the ratio crossed 50 days MA in Feb' 20 with Gold giving a breakout on the charts. The previous cross of 50 days MA didn't result in gold breaking out. pic.twitter.com/HRG1fvsILp