[Thead] Ben Knapper - Arsenal's Loan Manager.
It is usually the big guys, your Artetas, Edus and Vinais who make the headlines for Arsenal but there are so many more men and women who are putting in their best to make Arsenal successful and Ben Knapper is one of them.

- The background of Ben Knapper and the post he holds.
- His primary duties.
- His impact.
- Fringe payers who are struggling for game time and the club wants to send them on a loan move to boost their transfer value or keep them motivated and occupied in case they're needed next season.
- Players who were waiting for their work permit to play for the club and needed a loan move in order to earn the permit.
- Style of football.
- Competition at the club.
- Manager's view of the player.
- Player's view of the club.


“He calls me, I call him. He always messages me as well to see how training is going.

“When I was in Slovakia I was constantly speaking to him and he came over there to see me. We speak after the games, whether it’s been a good game or a bad game, he give me positives and he believes in me.

More from Finance

Thread: P&F Super Pattern
An effective price pattern defined using properties of P&F charts.
#Superpattern #Pointandfigure #Definedge
Point & Figure is an oldest charting method where price is plotted vertically, and the chart moves only when price moves. It is a different way of looking at the price, the objective box-value and reversal value offers advantage of identifying objective price patterns.
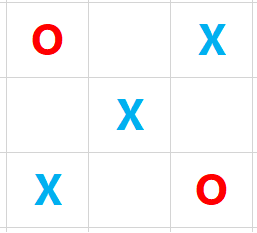
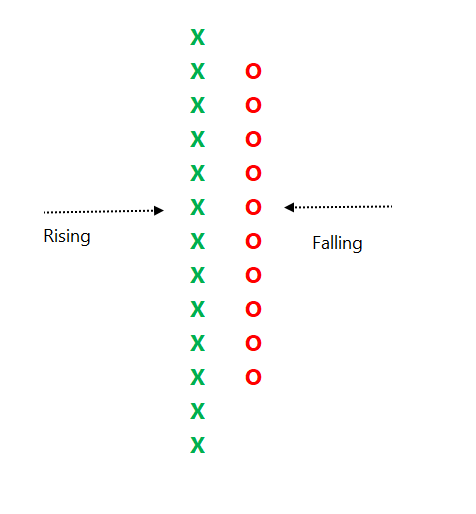
When price is moving up, it is plotted in a column of 'X'. When it is going down, it is plotted in a column of ‘O’. Normally, three-box reversal criteria is used to define the trend & reversal. Unlike a bar or candle, the P&F column can have multiple sessions in it.
Link to know more about the subject:
https://t.co/2xtLAVPBvm
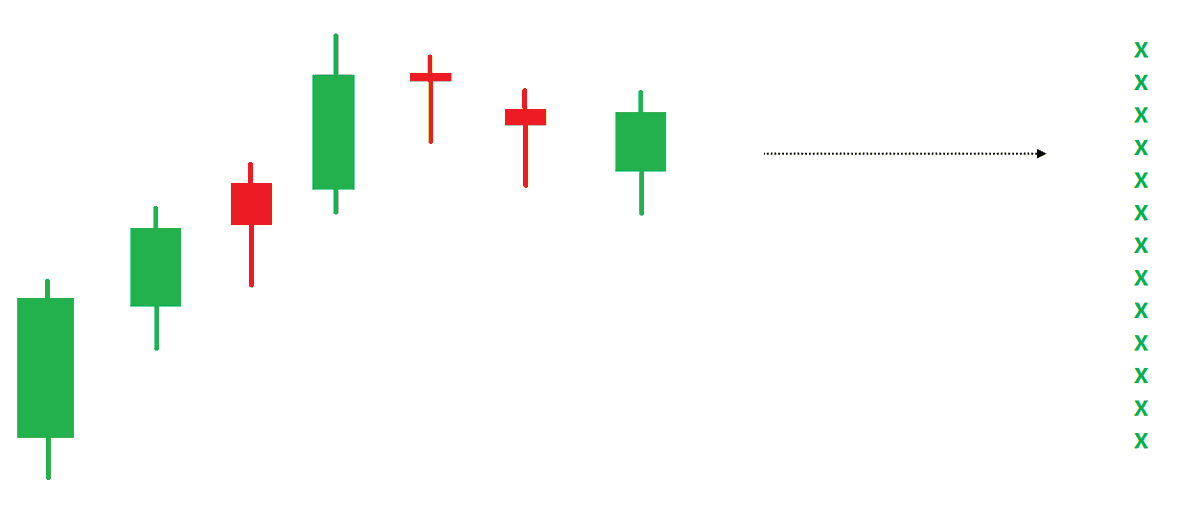
See below chart. Price is in a strong uptrend, P&F chart would produce a long of column of 'X' with more number of boxes in it.
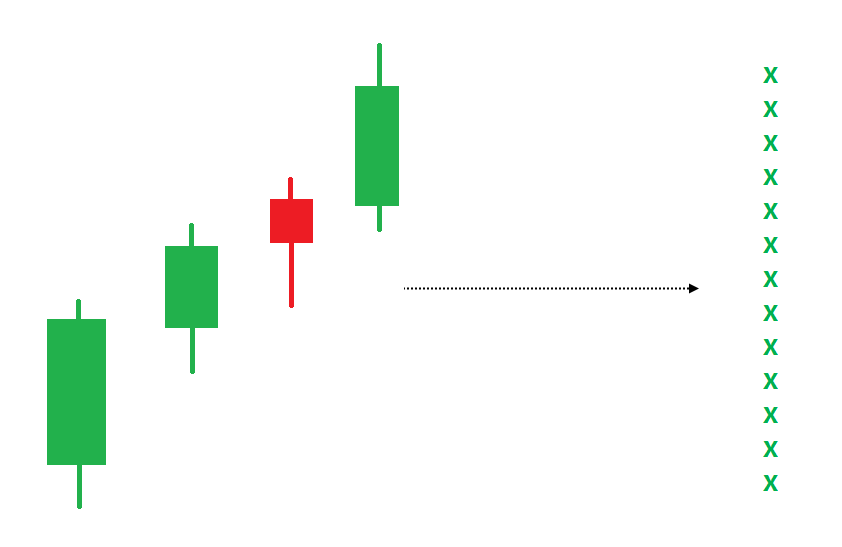
If such a trend is followed by some time bars without meaningful price correct, P&F chart would not move, and it will remain in column of 'X' in such a scenario.
An effective price pattern defined using properties of P&F charts.
#Superpattern #Pointandfigure #Definedge
Point & Figure is an oldest charting method where price is plotted vertically, and the chart moves only when price moves. It is a different way of looking at the price, the objective box-value and reversal value offers advantage of identifying objective price patterns.
When price is moving up, it is plotted in a column of 'X'. When it is going down, it is plotted in a column of ‘O’. Normally, three-box reversal criteria is used to define the trend & reversal. Unlike a bar or candle, the P&F column can have multiple sessions in it.
Link to know more about the subject:
https://t.co/2xtLAVPBvm
See below chart. Price is in a strong uptrend, P&F chart would produce a long of column of 'X' with more number of boxes in it.
If such a trend is followed by some time bars without meaningful price correct, P&F chart would not move, and it will remain in column of 'X' in such a scenario.


Two year back thread on MFI, someone liked this so came up in notifications . Rather than running around 100s of indicators, I have made this my go to indicator under any circumstances and have been using this for years
This thread actually had some great answers , one can learn a lot about the thought processes of different traders from the answers. Please go thru them
What do you think/use as the most robust leading indicator if following technical analysis ? Please answer with reason , I will provide my answer after 2 hours
— Subhadip Nandy (@SubhadipNandy16) August 12, 2019
( At Delhi airport , bored as hell )
This thread actually had some great answers , one can learn a lot about the thought processes of different traders from the answers. Please go thru them