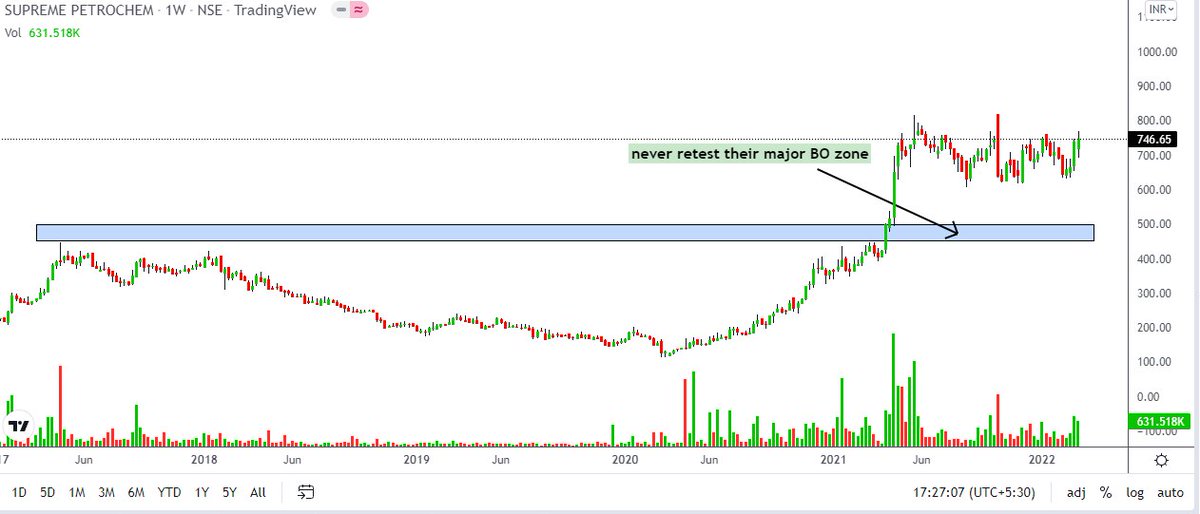
4. Then manually select the stocks which are going to give all time high BO or 52 high BO or already given.
Trading view scanner process -
1 - open trading view in your browser and select stock scanner in left corner down side .
2 - touch the percentage% gain change ( and u can see higest gainer of today)
Making thread \U0001f9f5 on trading view scanner by which you can select intraday and btst stocks .
— Vikrant (@Trading0secrets) October 22, 2021
In just few hours (Without any watchlist)
Some manual efforts u have to put on it.
Soon going to share the process with u whenever it will be ready .
"How's the josh?"guys \U0001f57a\U0001f3b7\U0001f483
4. Then manually select the stocks which are going to give all time high BO or 52 high BO or already given.
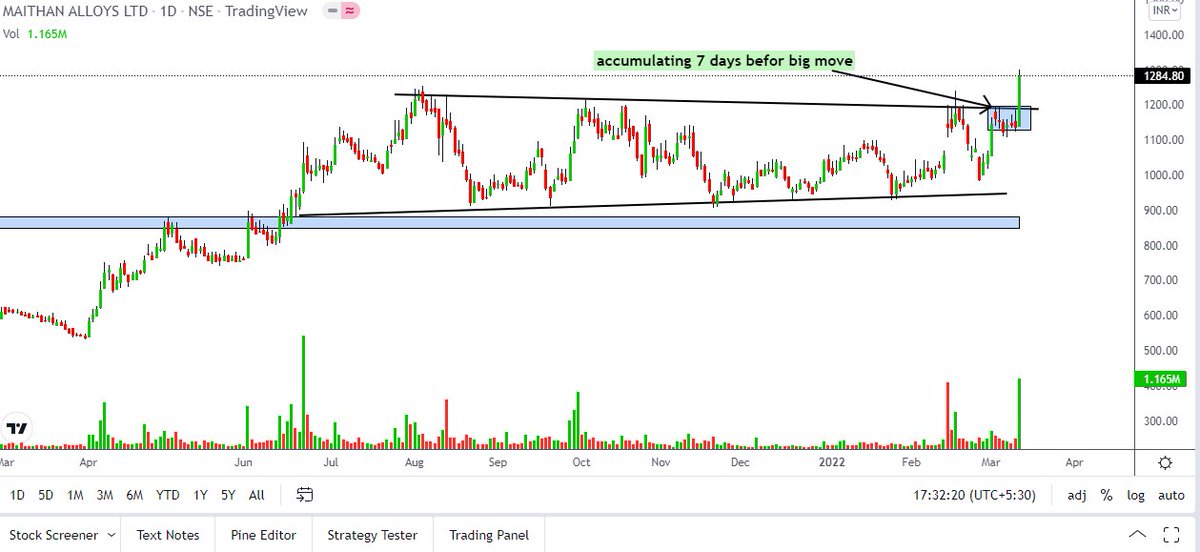
6 . If in 15 min chart📊 any stock sustaing near BO zone or after BO then select it on your watchlist
7 . Now next day if any stock show momentum u can take trade in it with RM
U will amazed to see it's result if you follow proper risk management.
I did 4x my capital by trading in only momentum stocks.
I will keep sharing such learning thread 🧵 for you 🙏💞🙏
Keep learning / keep sharing 🙏
@AdityaTodmal
More from Vikrant


Full #volume anlaysis thread 🧵
One thing which big player can never hide - VOLUME
Volume price interpretation -
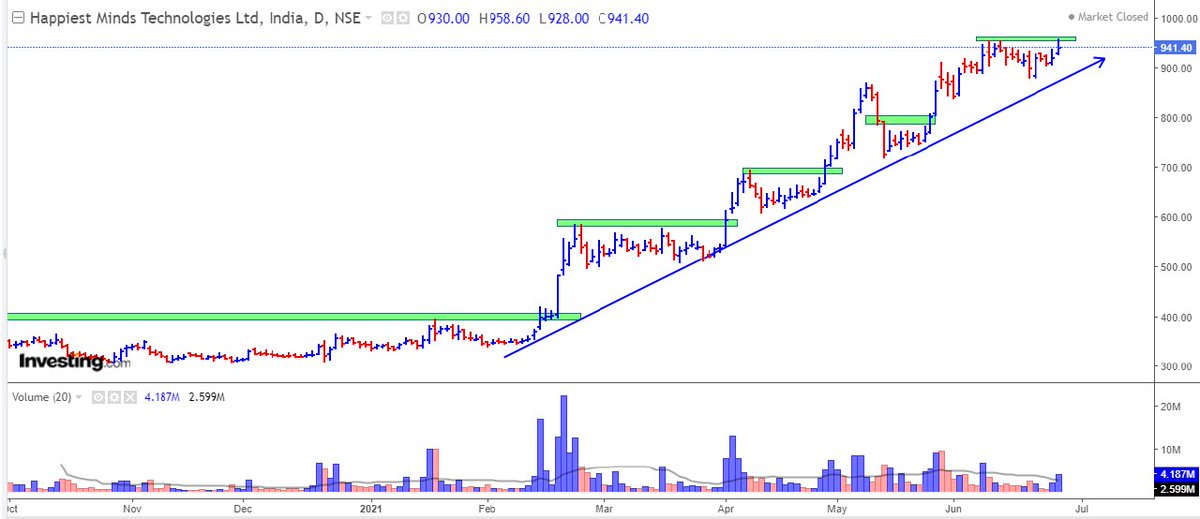
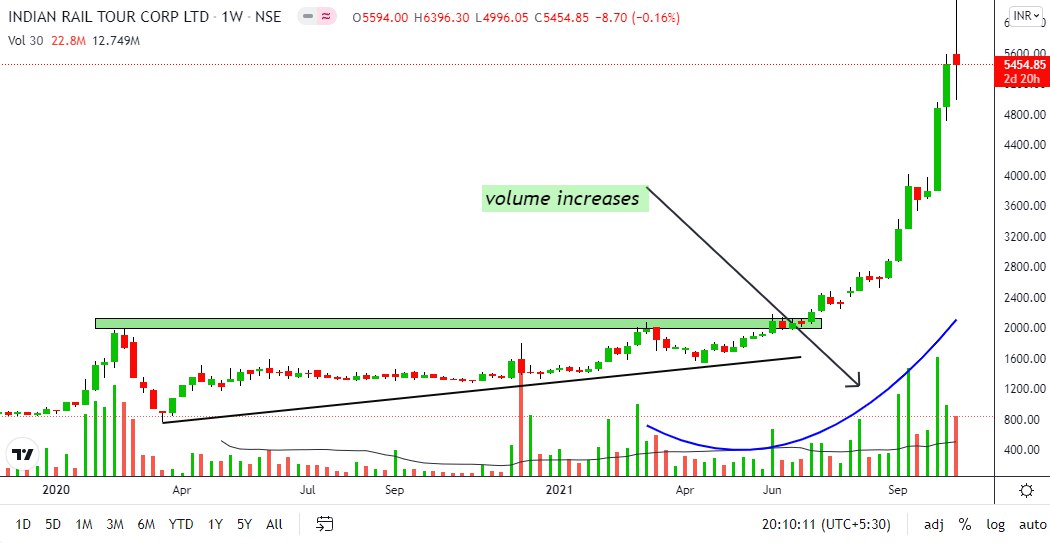
price increases + volume increases = bull 🐂
Price decreases + volume increases = bear 🐻
Price increases + volume decreases = fake upmove) sideways
Price decreases + volume decreases =fake downmove) sideways
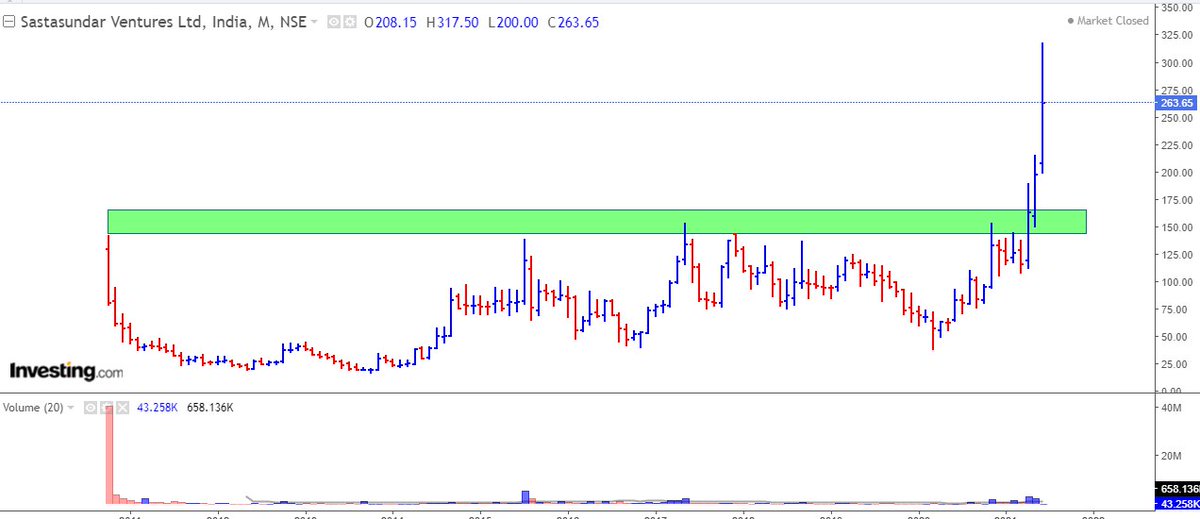
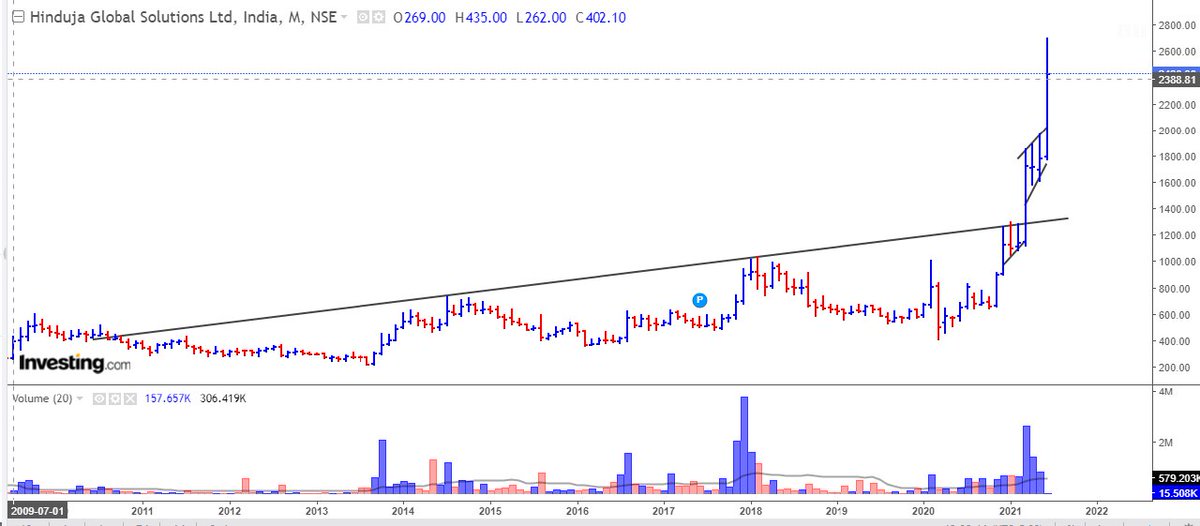
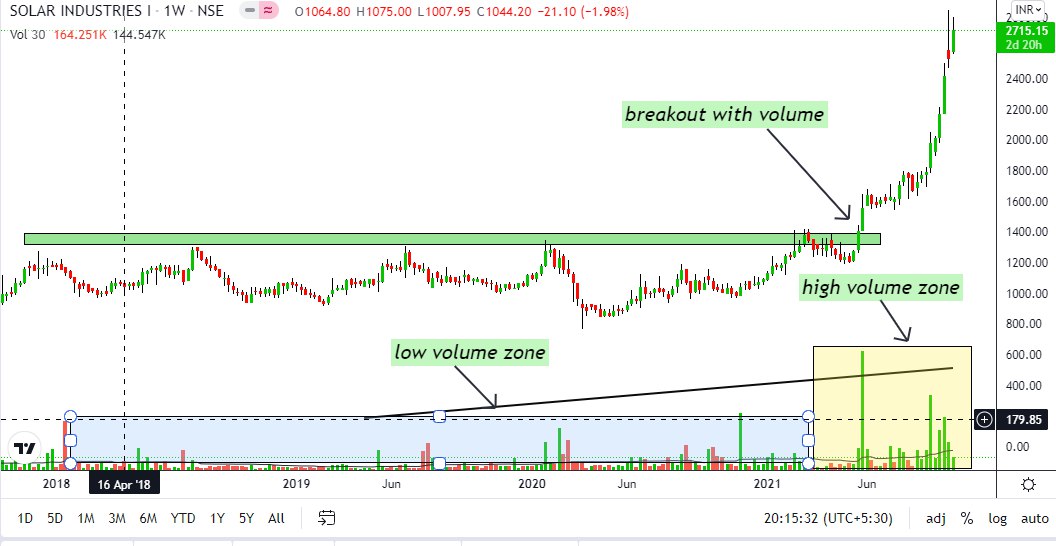
1⃣Always big breakout start with big VOLUME.
The higher the volume +higher the range = higher will be the move.
2⃣ IN the time of consolidation volumes are lower then upmove &.
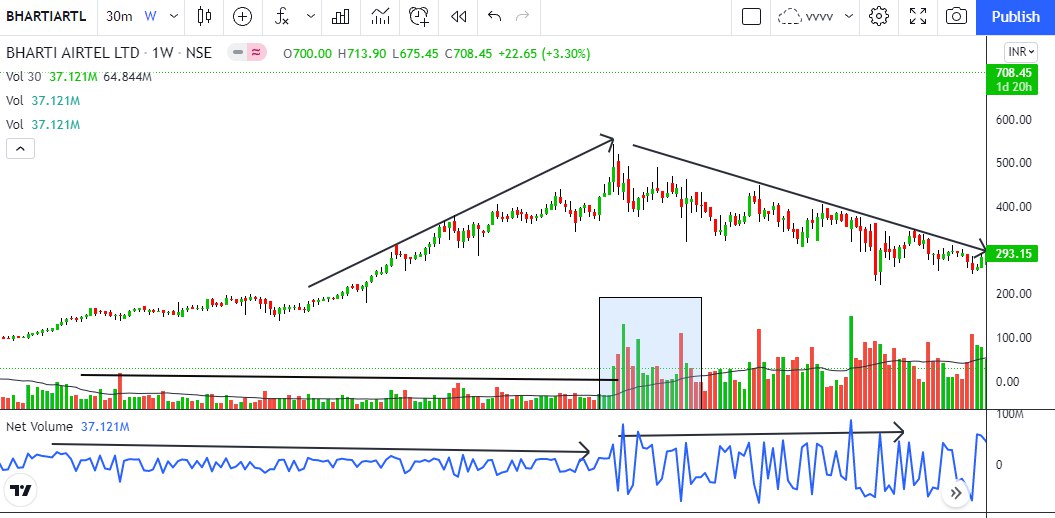
3️⃣ always trend changing move start with big volume action.
One thing which big player can never hide - VOLUME
preparing mega thread \U0001f9f5 of
— Vikrant (@Trading0secrets) October 18, 2021
#volume analysis .
Key points \U0001f4cd
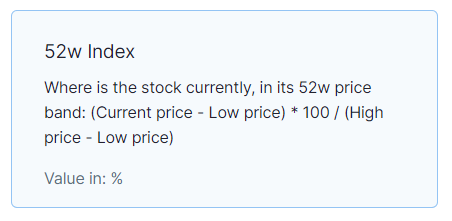
1\u20e3How should you interpret volume in different time frame?
2\u20e3how do you get that institution or big guys are accumulating ...
The full learning thread \U0001f9f5 about "VOLUME INTERPRETATION "
Stay tuned . \u0964\u0964\u0964\u0964\u0964
Volume price interpretation -
price increases + volume increases = bull 🐂
Price decreases + volume increases = bear 🐻
Price increases + volume decreases = fake upmove) sideways
Price decreases + volume decreases =fake downmove) sideways
1⃣Always big breakout start with big VOLUME.
The higher the volume +higher the range = higher will be the move.
2⃣ IN the time of consolidation volumes are lower then upmove &.
3️⃣ always trend changing move start with big volume action.
More from Equity


You May Also Like

#ஆதித்தியஹ்ருதயம் ஸ்தோத்திரம்
இது சூரிய குலத்தில் உதித்த இராமபிரானுக்கு தமிழ் முனிவர் அகத்தியர் உபதேசித்ததாக வால்மீகி இராமாயணத்தில் வருகிறது. ஆதித்ய ஹ்ருதயத்தைத் தினமும் ஓதினால் பெரும் பயன் பெறலாம் என மகான்களும் ஞானிகளும் காலம் காலமாகக் கூறி வருகின்றனர். ராம-ராவண யுத்தத்தை

தேவர்களுடன் சேர்ந்து பார்க்க வந்திருந்த அகத்தியர், அப்போது போரினால் களைத்து, கவலையுடன் காணப்பட்ட ராமபிரானை அணுகி, மனிதர்களிலேயே சிறந்தவனான ராமா போரில் எந்த மந்திரத்தைப் பாராயணம் செய்தால் எல்லா பகைவர்களையும் வெல்ல முடியுமோ அந்த ரகசிய மந்திரத்தை, வேதத்தில் சொல்லப்பட்டுள்ளதை உனக்கு
நான் உபதேசிக்கிறேன், கேள் என்று கூறி உபதேசித்தார். முதல் இரு சுலோகங்கள் சூழ்நிலையை விவரிக்கின்றன. மூன்றாவது சுலோகம் அகத்தியர் இராமபிரானை விளித்துக் கூறுவதாக அமைந்திருக்கிறது. நான்காவது சுலோகம் முதல் முப்பதாம் சுலோகம் வரை ஆதித்ய ஹ்ருதயம் என்னும் நூல். முப்பத்தி ஒன்றாம் சுலோகம்
இந்தத் துதியால் மகிழ்ந்த சூரியன் இராமனை வாழ்த்துவதைக் கூறுவதாக அமைந்திருக்கிறது.
ஐந்தாவது ஸ்லோகம்:
ஸர்வ மங்கள் மாங்கல்யம் ஸர்வ பாப ப்ரநாசனம்
சிந்தா சோக ப்ரசமனம் ஆயுர் வர்த்தனம் உத்தமம்
பொருள்: இந்த அதித்ய ஹ்ருதயம் என்ற துதி மங்களங்களில் சிறந்தது, பாவங்களையும் கவலைகளையும்

குழப்பங்களையும் நீக்குவது, வாழ்நாளை நீட்டிப்பது, மிகவும் சிறந்தது. இதயத்தில் வசிக்கும் பகவானுடைய அனுக்ரகத்தை அளிப்பதாகும்.
முழு ஸ்லோக லிங்க் பொருளுடன் இங்கே உள்ளது https://t.co/Q3qm1TfPmk
சூரியன் உலக இயக்கத்திற்கு மிக முக்கியமானவர். சூரிய சக்தியால்தான் ஜீவராசிகள், பயிர்கள்
இது சூரிய குலத்தில் உதித்த இராமபிரானுக்கு தமிழ் முனிவர் அகத்தியர் உபதேசித்ததாக வால்மீகி இராமாயணத்தில் வருகிறது. ஆதித்ய ஹ்ருதயத்தைத் தினமும் ஓதினால் பெரும் பயன் பெறலாம் என மகான்களும் ஞானிகளும் காலம் காலமாகக் கூறி வருகின்றனர். ராம-ராவண யுத்தத்தை
தேவர்களுடன் சேர்ந்து பார்க்க வந்திருந்த அகத்தியர், அப்போது போரினால் களைத்து, கவலையுடன் காணப்பட்ட ராமபிரானை அணுகி, மனிதர்களிலேயே சிறந்தவனான ராமா போரில் எந்த மந்திரத்தைப் பாராயணம் செய்தால் எல்லா பகைவர்களையும் வெல்ல முடியுமோ அந்த ரகசிய மந்திரத்தை, வேதத்தில் சொல்லப்பட்டுள்ளதை உனக்கு
நான் உபதேசிக்கிறேன், கேள் என்று கூறி உபதேசித்தார். முதல் இரு சுலோகங்கள் சூழ்நிலையை விவரிக்கின்றன. மூன்றாவது சுலோகம் அகத்தியர் இராமபிரானை விளித்துக் கூறுவதாக அமைந்திருக்கிறது. நான்காவது சுலோகம் முதல் முப்பதாம் சுலோகம் வரை ஆதித்ய ஹ்ருதயம் என்னும் நூல். முப்பத்தி ஒன்றாம் சுலோகம்
இந்தத் துதியால் மகிழ்ந்த சூரியன் இராமனை வாழ்த்துவதைக் கூறுவதாக அமைந்திருக்கிறது.
ஐந்தாவது ஸ்லோகம்:
ஸர்வ மங்கள் மாங்கல்யம் ஸர்வ பாப ப்ரநாசனம்
சிந்தா சோக ப்ரசமனம் ஆயுர் வர்த்தனம் உத்தமம்
பொருள்: இந்த அதித்ய ஹ்ருதயம் என்ற துதி மங்களங்களில் சிறந்தது, பாவங்களையும் கவலைகளையும்
குழப்பங்களையும் நீக்குவது, வாழ்நாளை நீட்டிப்பது, மிகவும் சிறந்தது. இதயத்தில் வசிக்கும் பகவானுடைய அனுக்ரகத்தை அளிப்பதாகும்.
முழு ஸ்லோக லிங்க் பொருளுடன் இங்கே உள்ளது https://t.co/Q3qm1TfPmk
சூரியன் உலக இயக்கத்திற்கு மிக முக்கியமானவர். சூரிய சக்தியால்தான் ஜீவராசிகள், பயிர்கள்