Insights from Philip Fisher. One of the best docs I came across for individual investors.
Phenomenal effort by @SiddharthVoraPL @PLIndiaOnline 👏👏
cc: @dmuthuk @Gautam__Baid @saxena_puru
https://t.co/K19gWk9TFO
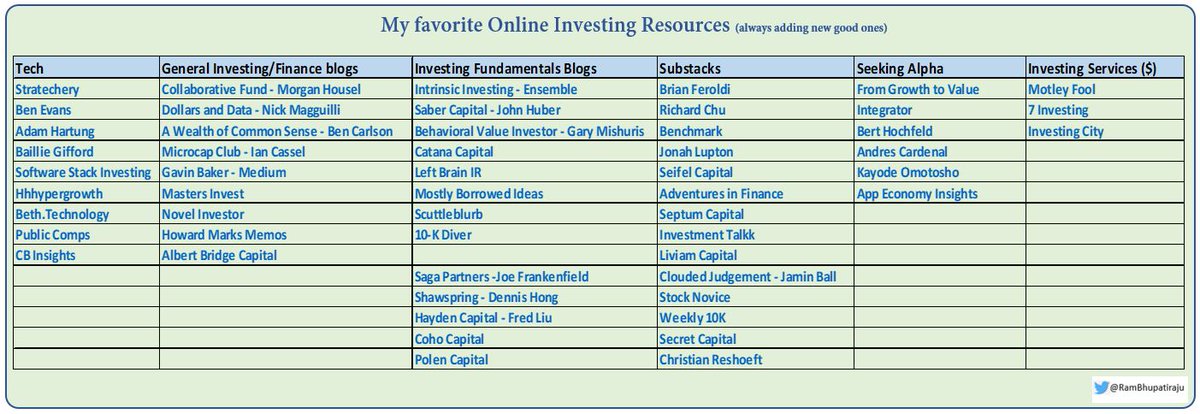
Full scale scuttlebutt is not possible for individual investors (lack of time, resources, contacts), but with efficient search & communication online (tuning out the noise), there are still some ways to do good research.


More from Ram Bhupatiraju
Happy 2⃣0⃣2⃣1⃣ to all.🎇
For any Learning machines out there, here are a list of my fav online investing resources. Feel free to add yours.
Let's dive in.
⬇️⬇️⬇️
Investing Services
✔️ @themotleyfool - @TMFStockAdvisor & @TMFRuleBreakers services
✔️ @7investing
✔️ @investing_city
https://t.co/9aUK1Tclw4
✔️ @MorningstarInc Premium
✔️ @SeekingAlpha Marketplaces (Check your area of interest, Free trials, Quality, track record...)
General Finance/Investing
✔️ @morganhousel
https://t.co/f1joTRaG55
✔️ @dollarsanddata
https://t.co/Mj1owkzRc8
✔️ @awealthofcs
https://t.co/y81KHfh8cn
✔️ @iancassel
https://t.co/KEMTBHa8Qk
✔️ @InvestorAmnesia
https://t.co/zFL3H2dk6s
✔️
Tech focused
✔️ @stratechery
https://t.co/VsNwRStY9C
✔️ @bgurley
https://t.co/NKXGtaB6HQ
✔️ @CBinsights
https://t.co/H77hNp2X5R
✔️ @benedictevans
https://t.co/nyOlasCY1o
✔️
Tech Deep dives
✔️ @StackInvesting
https://t.co/WQ1yBYzT2m
✔️ @hhhypergrowth
https://t.co/kcLKITRLz1
✔️ @Beth_Kindig
https://t.co/CjhLRdP7Rh
✔️ @SeifelCapital
https://t.co/CXXG5PY0xX
✔️ @borrowed_ideas
The (investing) world is full of noise📢. Tune that out and find your signal.🗼
Investing websites/blogs that I shared during the @FintwitSummit last weekend. With some minor changes and lot of additional commentary in the thread below. ⬇️⬇️
My investing diet 🗒️
✔️Zero Financial TV.
✔️Very little Market & Stock prices commentary/content.
✔️Lot of Company produced presentations/statements.
✔️ Lot of Investing Podcasts (thread some other time).
✔️Lot of below awesome content whenever I find time.
Tech : Have to start with my favorite sector
✅ @stratechery
For deeper understanding of Platforms and Aggregators.
https://t.co/VsNwRStY9C
✅ @benedictevans
Phenomenal essays related to
✅ @adam_hartung
Extremely good if you are into following & investing in strong/durable trends.
https://t.co/IOE1pmkqbi
✅ @BaillieGifford
Mind blowing, if you're into extremely patient and visionary style of
✅ @StackInvesting
Must read if you love the combination of Software + Investing
https://t.co/WQ1yBYzT2m
✅ @hhhypergrowth
Phenomenal writing if you love technical deep dives into SaaS
https://t.co/kcLKITRLz1
✅ @Beth_Kindig
Sharp Tech focused
Excellent short summaries of many good investing books. 👏
cc: @dmuthuk @Gautam__Baid
(Some of the pages might open in German. Use the Translate to English option on the
List 👇
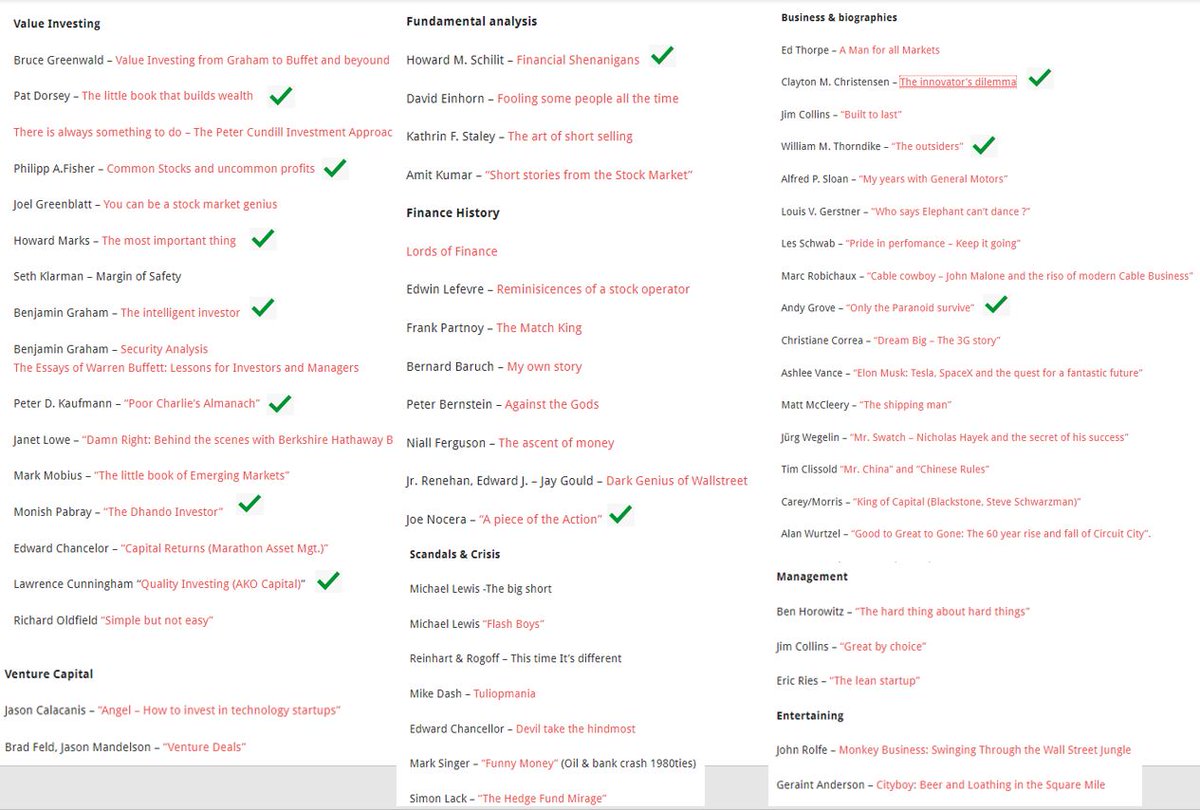
Some of my fav summaries from the list.
✔️Quality Investing - Lawrence Cunningham
https://t.co/pmVQFPlWby
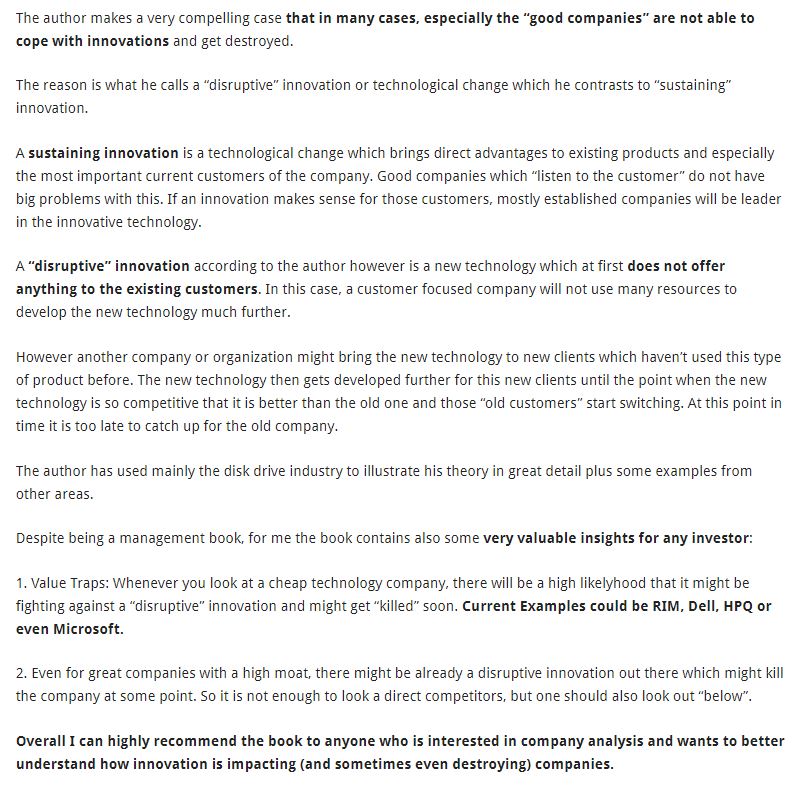
✔️The Innovator's Dilemma – Clayton Christensen
https://t.co/VazvMPEE7D
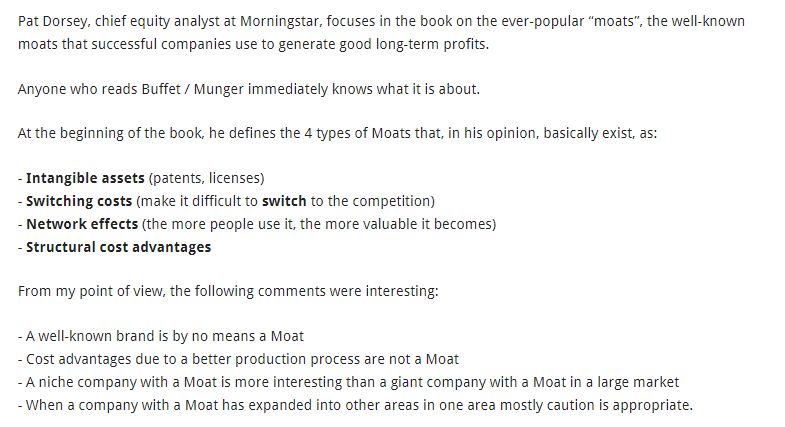
✔️The Little Book That Builds Wealth - Pat Dorsey
https://t.co/sMJspTTQcA
cc: @dmuthuk @Gautam__Baid
(Some of the pages might open in German. Use the Translate to English option on the
List 👇
Some of my fav summaries from the list.
✔️Quality Investing - Lawrence Cunningham
https://t.co/pmVQFPlWby
✔️The Innovator's Dilemma – Clayton Christensen
https://t.co/VazvMPEE7D
✔️The Little Book That Builds Wealth - Pat Dorsey
https://t.co/sMJspTTQcA

More from Equity


You May Also Like


1/ Some initial thoughts on personal moats:
Like company moats, your personal moat should be a competitive advantage that is not only durable—it should also compound over time.
Characteristics of a personal moat below:
2/ Like a company moat, you want to build career capital while you sleep.
As Andrew Chen noted:
3/ You don’t want to build a competitive advantage that is fleeting or that will get commoditized
Things that might get commoditized over time (some longer than
4/ Before the arrival of recorded music, what used to be scarce was the actual music itself — required an in-person artist.
After recorded music, the music itself became abundant and what became scarce was curation, distribution, and self space.
5/ Similarly, in careers, what used to be (more) scarce were things like ideas, money, and exclusive relationships.
In the internet economy, what has become scarce are things like specific knowledge, rare & valuable skills, and great reputations.
Like company moats, your personal moat should be a competitive advantage that is not only durable—it should also compound over time.
Characteristics of a personal moat below:
I'm increasingly interested in the idea of "personal moats" in the context of careers.
— Erik Torenberg (@eriktorenberg) November 22, 2018
Moats should be:
- Hard to learn and hard to do (but perhaps easier for you)
- Skills that are rare and valuable
- Legible
- Compounding over time
- Unique to your own talents & interests https://t.co/bB3k1YcH5b
2/ Like a company moat, you want to build career capital while you sleep.
As Andrew Chen noted:
People talk about \u201cpassive income\u201d a lot but not about \u201cpassive social capital\u201d or \u201cpassive networking\u201d or \u201cpassive knowledge gaining\u201d but that\u2019s what you can architect if you have a thing and it grows over time without intensive constant effort to sustain it
— Andrew Chen (@andrewchen) November 22, 2018
3/ You don’t want to build a competitive advantage that is fleeting or that will get commoditized
Things that might get commoditized over time (some longer than
Things that look like moats but likely aren\u2019t or may fade:
— Erik Torenberg (@eriktorenberg) November 22, 2018
- Proprietary networks
- Being something other than one of the best at any tournament style-game
- Many "awards"
- Twitter followers or general reach without "respect"
- Anything that depends on information asymmetry https://t.co/abjxesVIh9
4/ Before the arrival of recorded music, what used to be scarce was the actual music itself — required an in-person artist.
After recorded music, the music itself became abundant and what became scarce was curation, distribution, and self space.
5/ Similarly, in careers, what used to be (more) scarce were things like ideas, money, and exclusive relationships.
In the internet economy, what has become scarce are things like specific knowledge, rare & valuable skills, and great reputations.