
It's the weekend!
Grab a cup of coffee, in this thread I will explain
1. What is a Dividend Discount Model?
2. What are its main components?
3. How to use it to value a business?
Lets dive right in.

Return here stands for the cash flow generated by the asset.

For Fixed Deposits = Returns are Interest Payments
For Real Estate = Returns are Rent Payments
For Debt Securities = Returns are coupon payments
For Stocks = Returns are Dividends + Any Appreciation in Stock Price
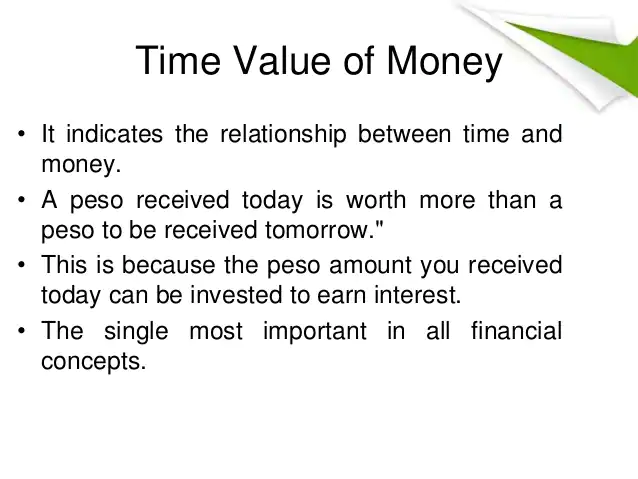
Why?
Cause Rs 100 today is worth more than Rs 100, 10 years later.
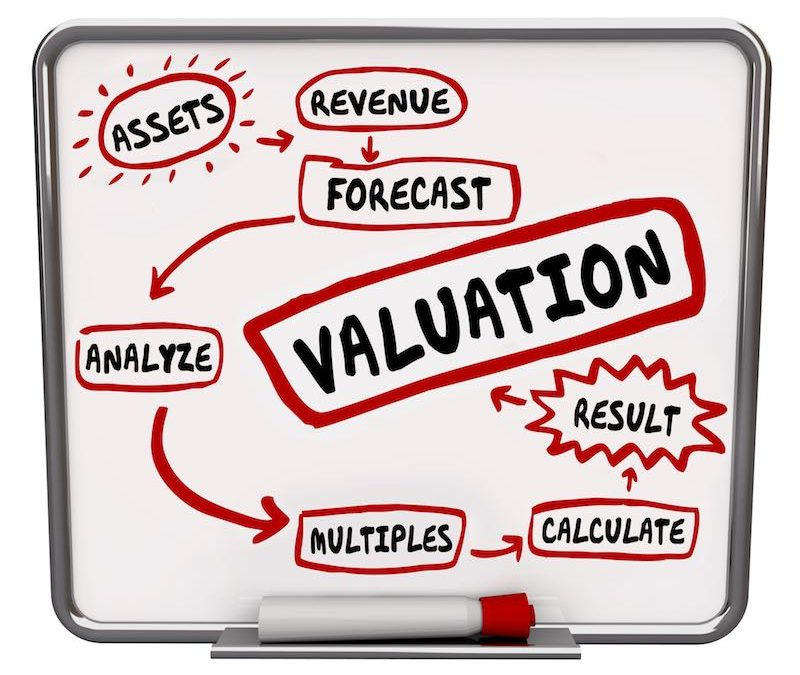
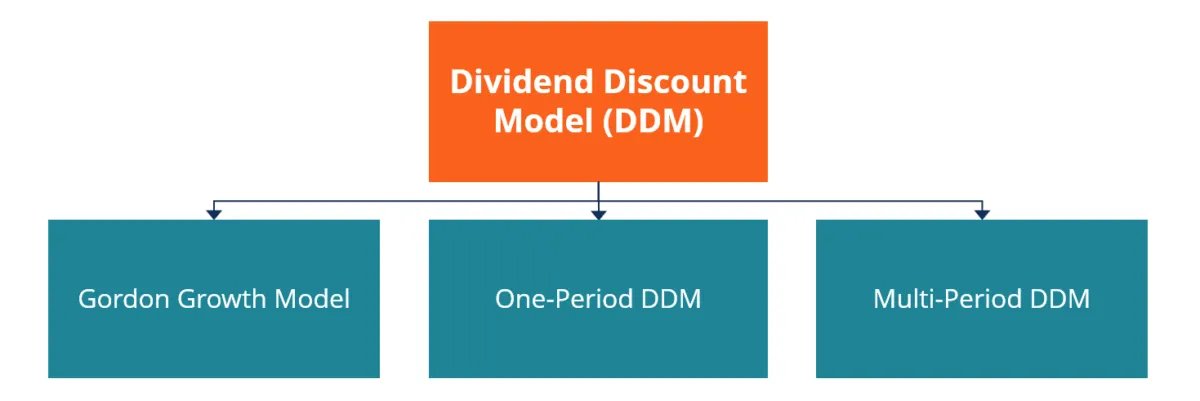
All of these models combined are known as Valuation Models.
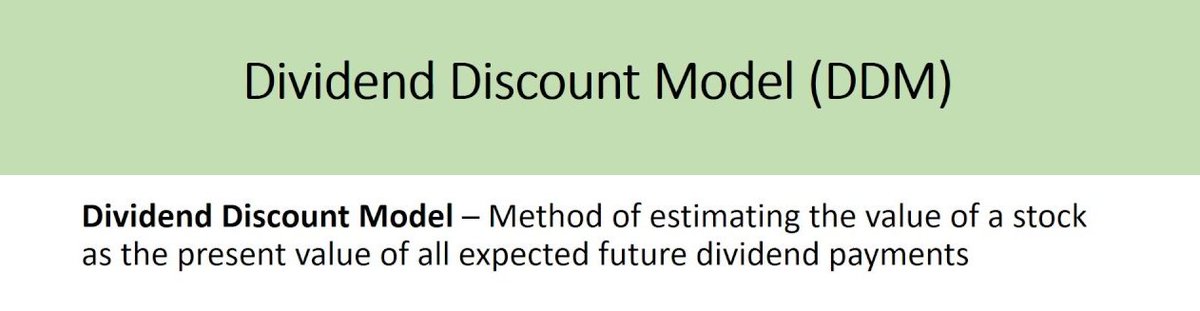
Dividend Discount Model is one amongst them.
It states that the intrinsic value of a stock is the present value of all its future dividend combined.
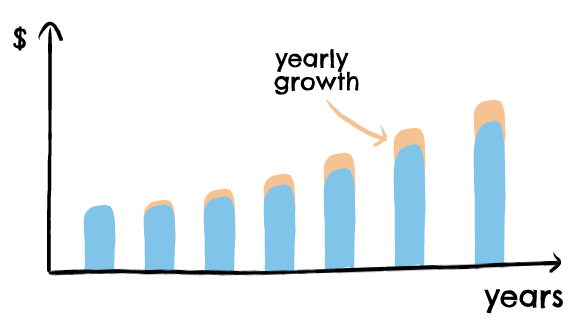
Good businesses generate profits every year and since you own a piece (shares) of a profit generating business, you are entitled to received a part of those profits every year.
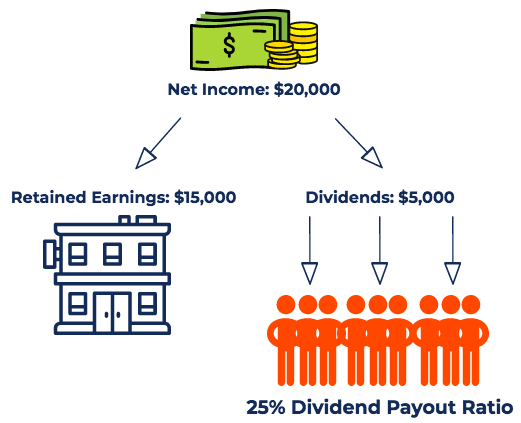
Dividend Discount Model states that you can get a fair sense of the correct value of the stock if you can estimate how much dividend will be paid out by the company to you (the investor) during your holding period.
1. Single Period DDM
2. Multi Period DDM
3. Gordon Growth Model
If we can estimate profits and growth rate for the next 10 years, we can estimate the dividend we may receive and as such can arrive at the fair value of the stock.


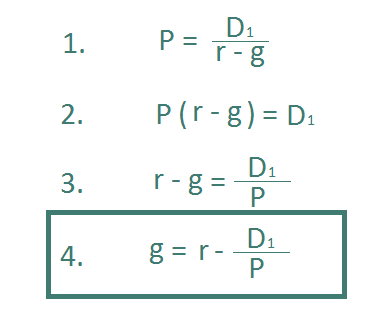
PV = present value of the company (this is what we are estimating)
D1 = Dividend we will receive next year (assuming we are only buying the stock for one year)
r = Cost of Capital
g = Growth Rate
Cost of Capital simply refers to the cost of raising funds.
There are only two ways a company can raise funds
1. Borrow from a Bank or Institution (Debt)
2. Issues shares to potential investors (Equity)
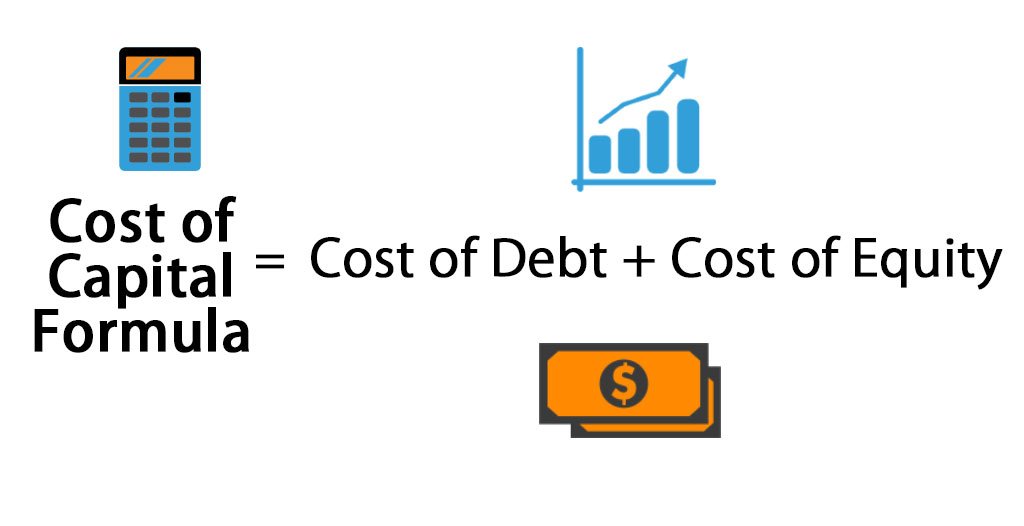
For debt it is the interest rate at which the debt is issued.
For equity it is a combination of various risk specific required returns that investors expect from the company.
For now, just remember that 'r' in Dividend Discount Model stands for cost of capital which ultimately means costs of raising funds.
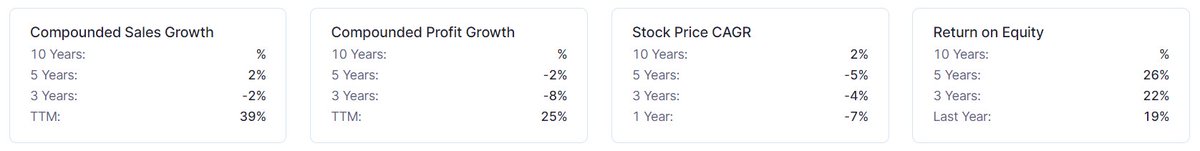
Growth Rate in the formula is referring to growth in profits of the company.
Its better to use a normalized growth rate, i.e., growth rate over a large time frame that includes period of both high and low growth.
Hero Moto Corp has been paying out 70%+ of its yearly profits as dividends
Latest Dividend Payout was 71.9%
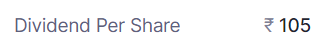
The latest 12 Month Dividend for the company was Rs 105 per share
Your Growth Rate needs to take a full cycle, i.e., both periods of normal and abnormal growth.
The Growth Rate should also be in line with your investment horizon, i.e., how long you want to invest for.
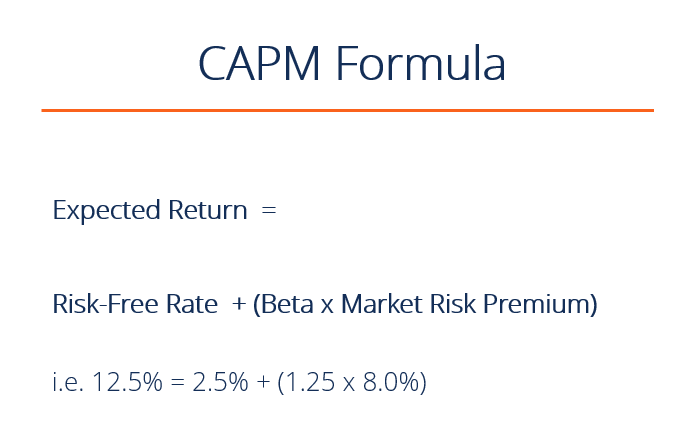
This is slightly complicated and there are other models like Capital Asset Pricing Model (CAPM) which help us determine the cost of equity for a company.
I will post another thread to explain CAPM in detail.
For now let's assume this to be 14%.


This method helps you find the implied growth rate that market is pricing in for the company.
Before we end this thread, lets explore some of them.

The model only works for companies that
1. Are paying a Dividend
2. Dividend has a clear linear relationship with profitability

The model doesn't incorporate any non linear growth factors of a company like
Optionalities (Hero moving into Electric Vehicles)
Increase in Margins
Market Structures

Any change in assumption of 'r' and 'g' in the formula can sway the model and the intrinsic value can move by orders of magnitude.
So be very careful and conservative in your assumptions of 'r' and 'g'.
If you want to practice this, take example of ITC and post your valuation model in comments, I will be happy to retweet and provide feedback.

Its one of the easiest models to learn and understand the process of valuations.
If you're new here, I write a thread every weekend, explaining an investing concept.
Here is a link to my last weekend's thread.
https://t.co/Qc4Rh1Qx07
It's the weekend!
— Tar \u26a1 (@itsTarH) September 4, 2021
Grab a cup of coffee, in this thread I will explain
1. What is a Balance Sheet?
2. Why is it important?
3. What does it tell you about a business?
Lets dive right in. pic.twitter.com/doYHQM5QnA
Get access to the class by using the below link
https://t.co/VyPiV7u7pp
https://t.co/UhAgK7aMlU
Get access to the class by using the below link
https://t.co/f8AE9aYqGF
https://t.co/r7uNYuqjsn
Subscribe for FREE, if you're interested and join 3000+ readers that get insights on companies like Nykaa, PolicyBazaar, Renewables, etc. delivered straight to their inbox every few weeks.
https://t.co/7Ct4WTVGdo
@itsTarH
I write a new thread every weekend.
All my previous work, can be found here.
https://t.co/az1Rsw05TO
All my Threads so far \U0001f9f5 \U0001f447\U0001f3fc
— Tar \u26a1 (@itsTarH) June 5, 2021

More from Tar ⚡


You May Also Like


On the occasion of youtube 20k and Twitter 70k members
A small tribute/gift to members
Screeners
technical screeners - intraday and positional both
before proceeding - i have helped you , can i ask you so that it can help someone else too
thank you
positional one
run - find #stock - draw chart - find levels
1- Stocks closing daily 2% up from 5 days
https://t.co/gTZrYY3Nht
2- Weekly breakout
https://t.co/1f4ahEolYB
3- Breakouts in short term
https://t.co/BI4h0CdgO2
4- Bullish from last 5
intraday screeners
5- 15 minute Stock Breakouts
https://t.co/9eAo82iuNv
6- Intraday Buying seen in the past 15 minutes
https://t.co/XqAJKhLB5G
7- Stocks trading near day's high on 5 min chart with volume BO intraday
https://t.co/flHmm6QXmo
Thank you


Fake chats claiming to be from the Irish African community are being disseminated by the far right in order to suggest that violence is imminent from #BLM supporters. This is straight out of the QAnon and Proud Boys playbook. Spread the word. Protest safely. #georgenkencho

There is co-ordination across the far right in Ireland now to stir both left and right in the hopes of creating a race war. Think critically! Fascists see the tragic killing of #georgenkencho, the grief of his community and pending investigation as a flashpoint for action.
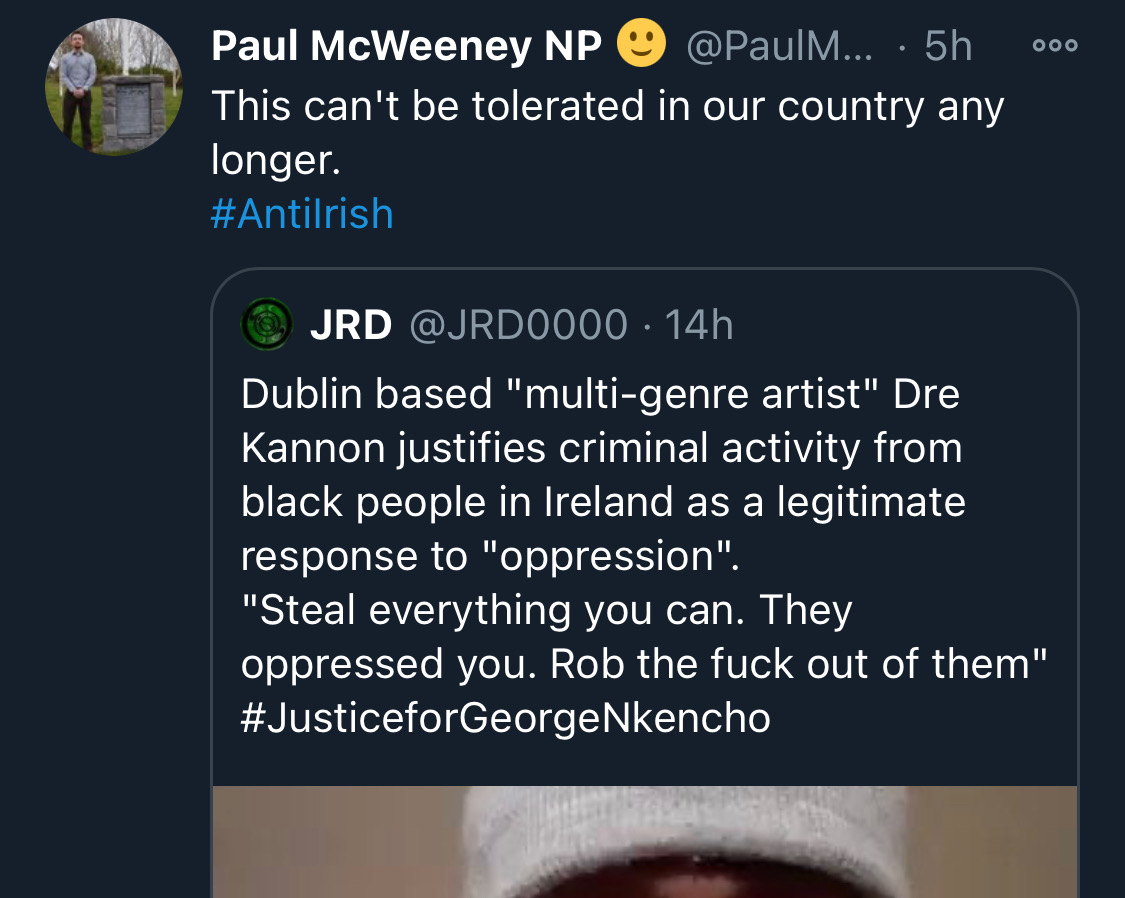
Across Telegram, Twitter and Facebook disinformation is being peddled on the back of these tragic events. From false photographs to the tactics ofwhite supremacy, the far right is clumsily trying to drive hate against minority groups and figureheads.
Declan Ganley’s Burkean group and the incel wing of National Party (Gearóid Murphy, Mick O’Keeffe & Co.) as well as all the usuals are concerted in their efforts to demonstrate their white supremacist cred. The quiet parts are today being said out loud.
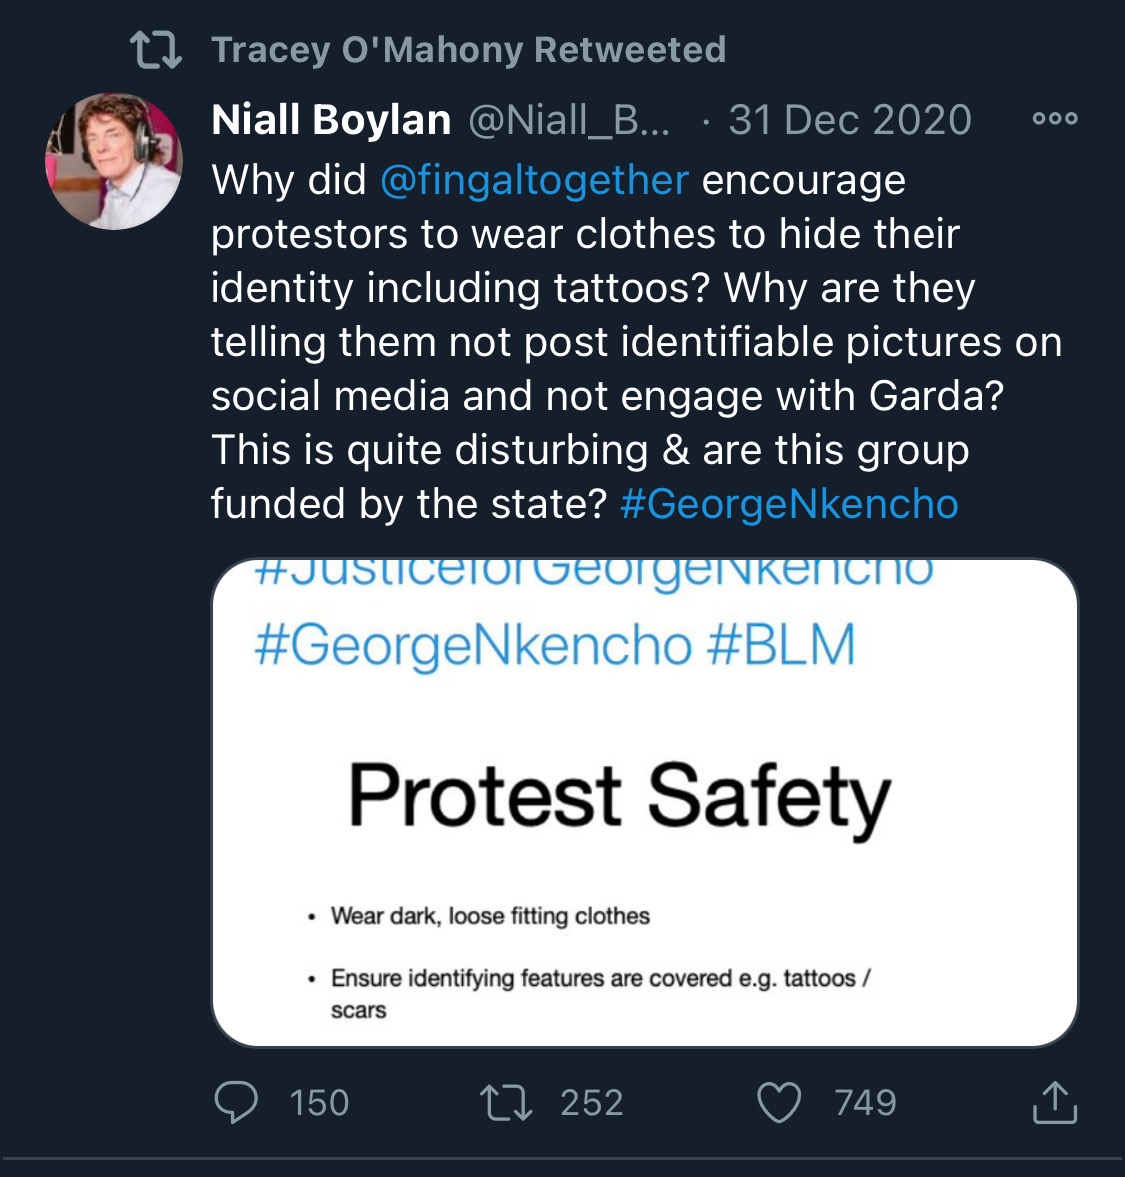
The best thing you can do is challenge disinformation and report posts where engagement isn’t appropriate. Many of these are blatantly racist posts designed to drive recruitment to NP and other Nationalist groups. By all means protest but stay safe.
There is co-ordination across the far right in Ireland now to stir both left and right in the hopes of creating a race war. Think critically! Fascists see the tragic killing of #georgenkencho, the grief of his community and pending investigation as a flashpoint for action.
Across Telegram, Twitter and Facebook disinformation is being peddled on the back of these tragic events. From false photographs to the tactics ofwhite supremacy, the far right is clumsily trying to drive hate against minority groups and figureheads.
Be aware, the images the #farright are sharing in the hopes of starting a race war, are not of the SPAR employee that was punched. They\u2019re older photos of a Everton fan. Be aware of the information you\u2019re sharing and that it may be false. Always #factcheck #GeorgeNkencho pic.twitter.com/4c9w4CMk5h
— antifa.drone (@antifa_drone) December 31, 2020
Declan Ganley’s Burkean group and the incel wing of National Party (Gearóid Murphy, Mick O’Keeffe & Co.) as well as all the usuals are concerted in their efforts to demonstrate their white supremacist cred. The quiet parts are today being said out loud.
There is a concerted effort in far-right Telegram groups to try and incite violence on street by targetting people for racist online abuse following the killing of George Nkencho
— Mark Malone (@soundmigration) January 1, 2021
This follows on and is part of a misinformation campaign to polarise communities at this time.
The best thing you can do is challenge disinformation and report posts where engagement isn’t appropriate. Many of these are blatantly racist posts designed to drive recruitment to NP and other Nationalist groups. By all means protest but stay safe.