
it seems dumb, and almost counter-intuitive to approach such a complex game like trading with such a simple approach like shapes...but maybe when markets start acting stupid its okay to dumb down our approach.
TRIANGLE MASTERCLASS - a thread.
what's the simplest, most effective method of trading a market that trends as hard as cryptocurrencies?
trendlines.
one trendline on its own is strong, but when you put two together you quickly realize just how powerful this simple tool can be.

it seems dumb, and almost counter-intuitive to approach such a complex game like trading with such a simple approach like shapes...but maybe when markets start acting stupid its okay to dumb down our approach.
anybody can draw some lines on a chart any way they'd like. sometimes, we let our bias affect our charts rather than the other way around.
i personally have done this more times than i can count.
you want a fluid bias that can change easily, rather than one relying on 10 steps of conflicting confirmation before entering a new trade
i mean, how much simpler can it be than "above this line bullish, below this line bearish" ? 😂
one trendline on its own can be enough to make a good trade, but when you put two together it can turn a good trade into a great one.
two types: halves and wholes
two directions: up and down
why are they called halves?
well...simply because they're halves of wholes.
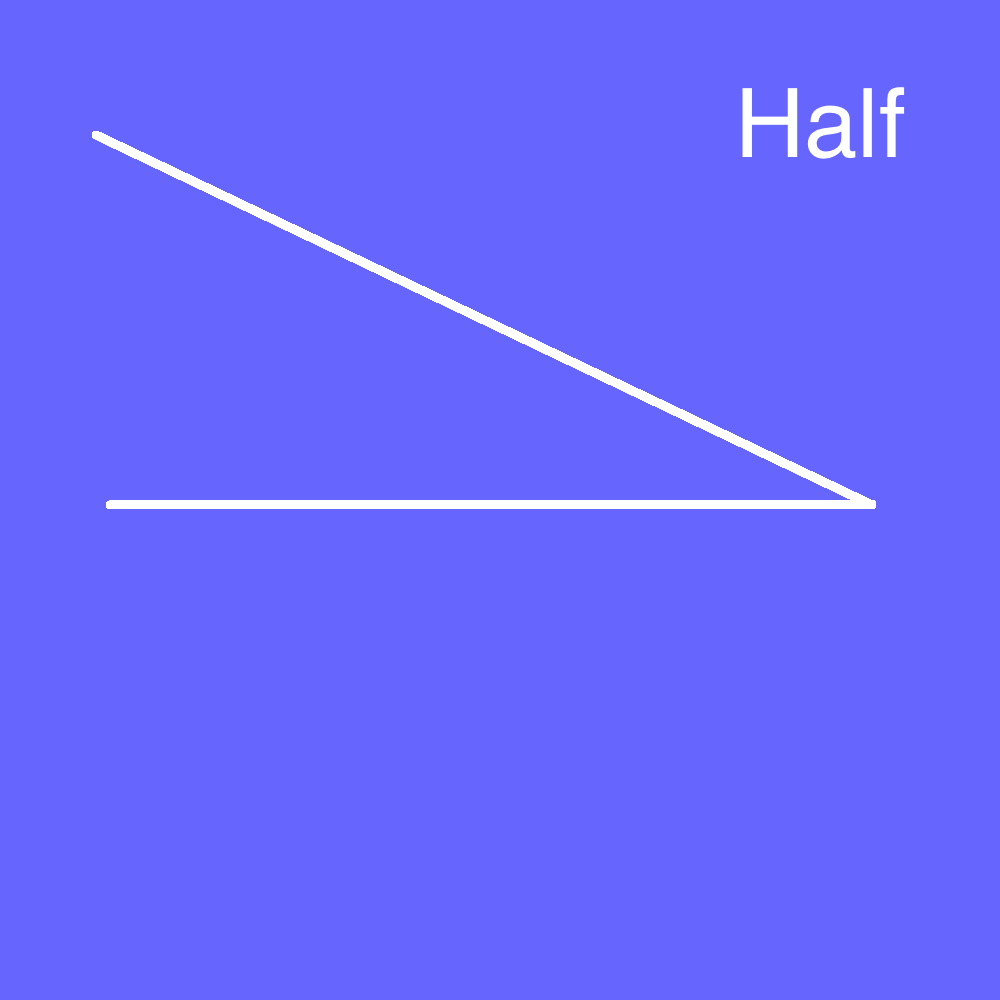
it then becomes very simple as the direction of the side thats not flat dictates if you're bullish or bearish.
trendline up = bullish ... trendline down = bearish
it's that simple.
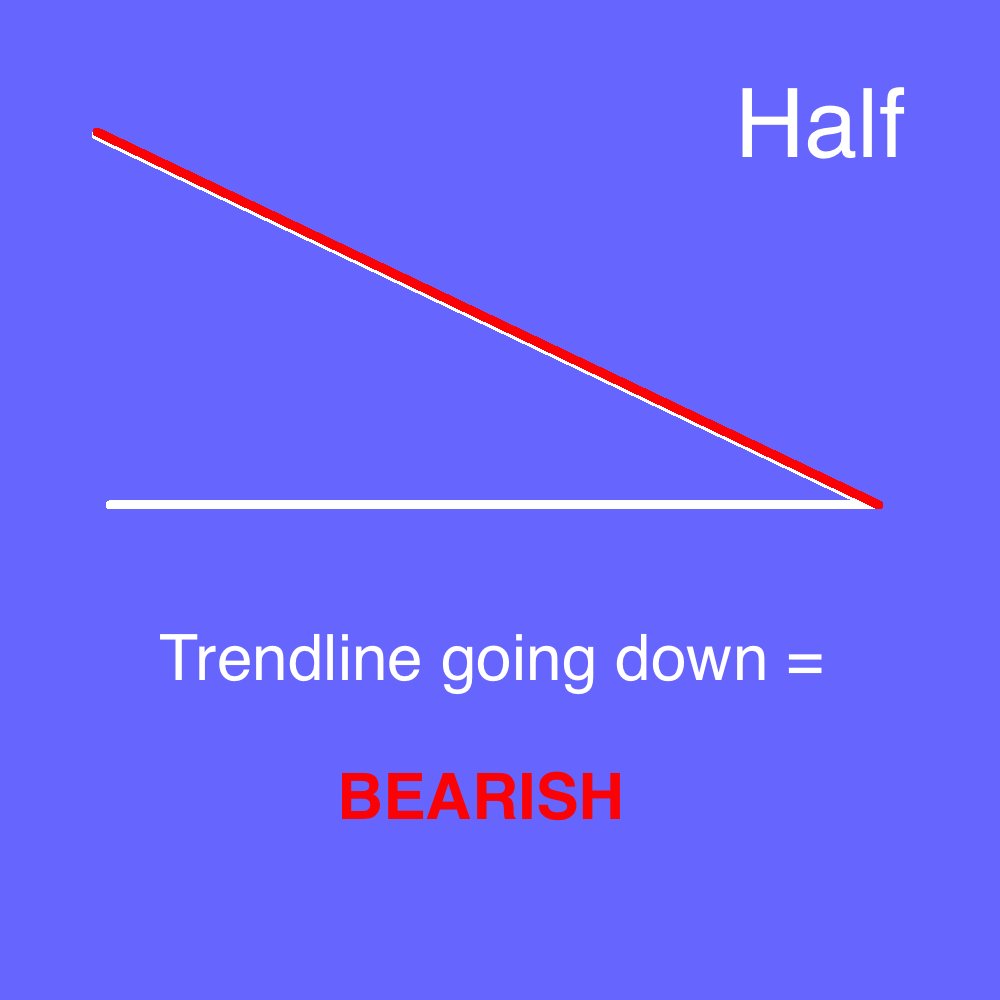
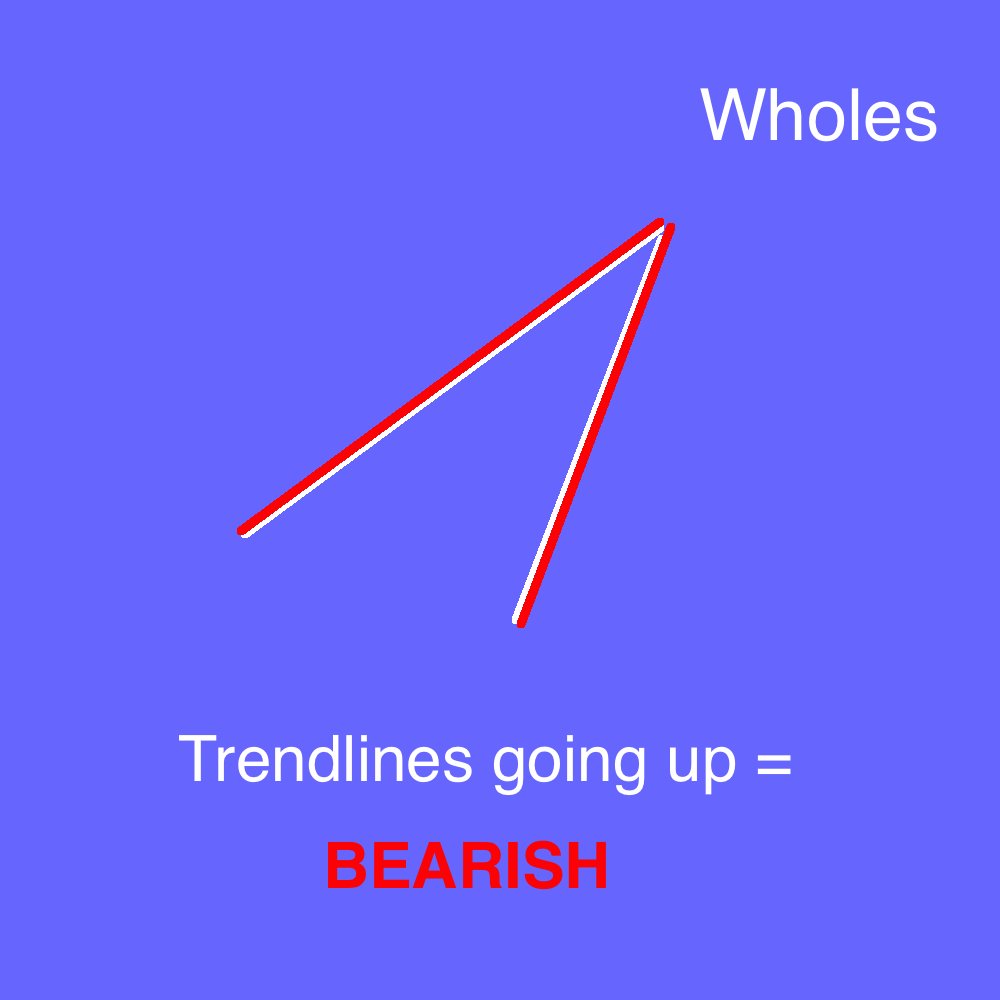
wholes are interesting because with halves, your trendline dictates that price will *CONTINUE* in that direction...
while with wholes your trendlines actually dictate that price will *REVERSE*
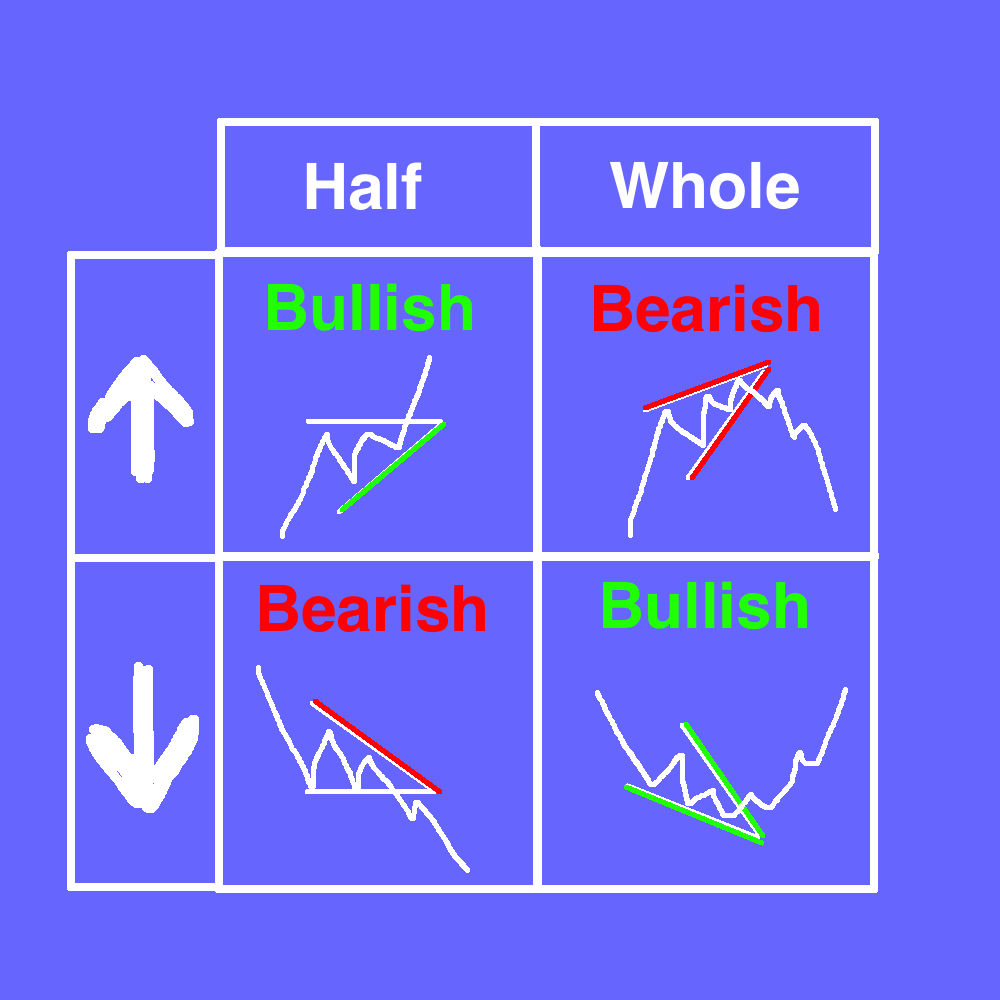
well...that wouldn't be true in every market environment.
but when you're participating in a market that trends as hard as crypto is right now...it certainly can be
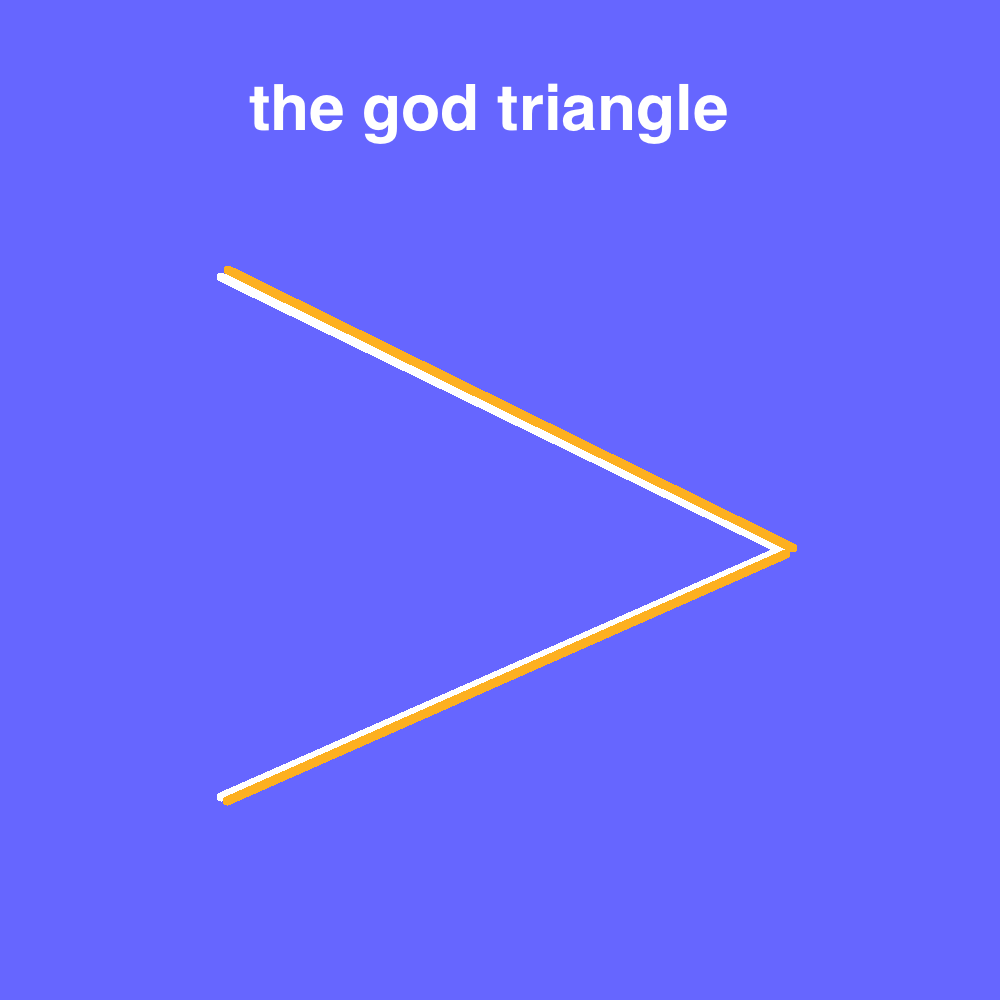
the god triangle.
the way way that price cycles, momentum does as well.
coins rally, then they cool off, and then they either rally more or reverse.
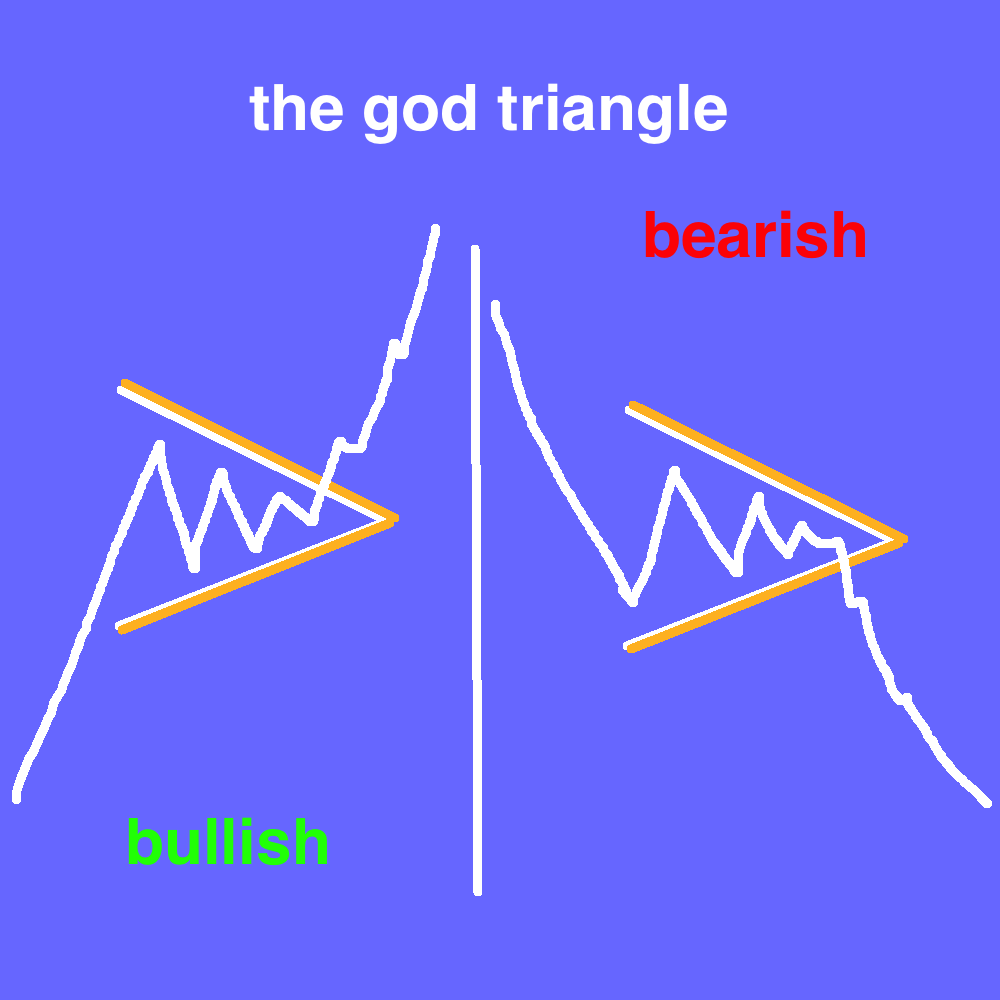
it represents a continuation in trend.
so if price was going *up* into the triangle, its bullish
if price was going *down* into the triangle, its bearish
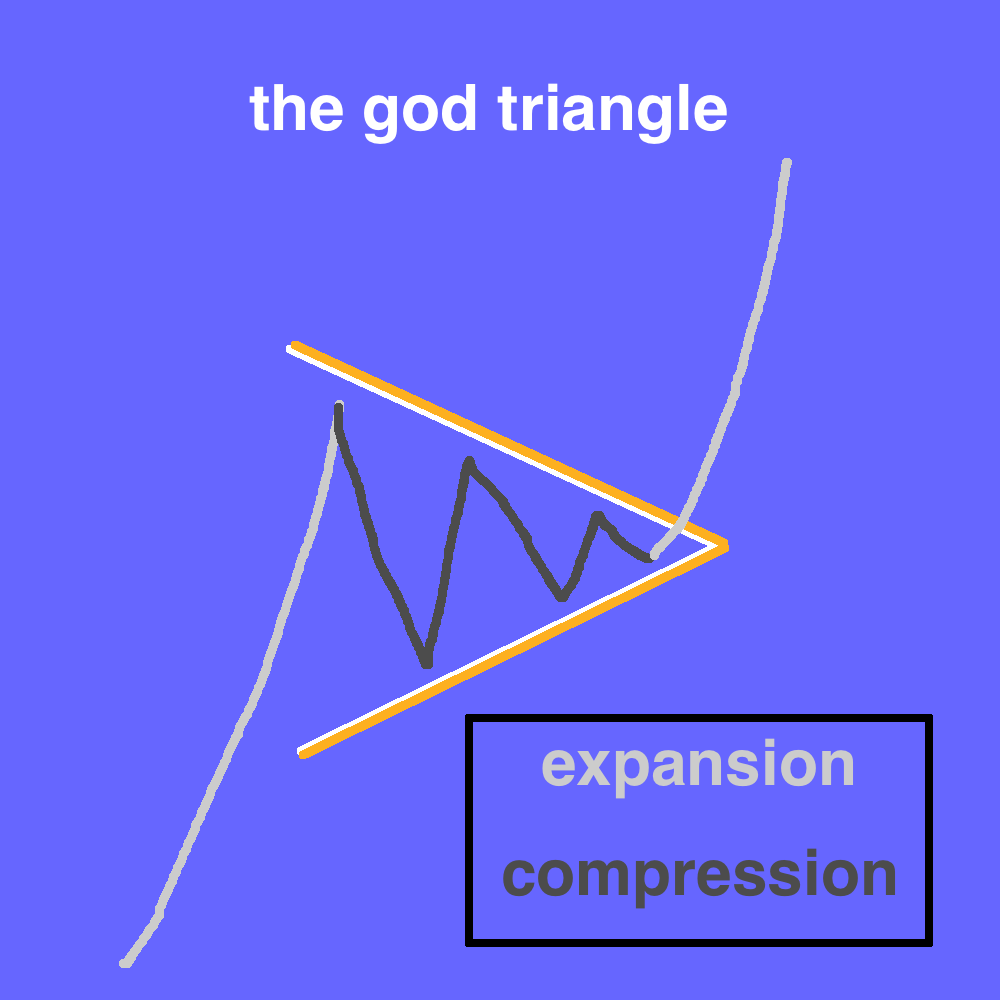
within the triangle, price is compressing.
remember price goes up, then stalls, then either keeps going up or reverses.
expansion -> compression -> expansion
you place your stoploss either below the trendline...or below the previous low that was set within the triangle
this is how you give yourself high hit-rate, high R/R plays.
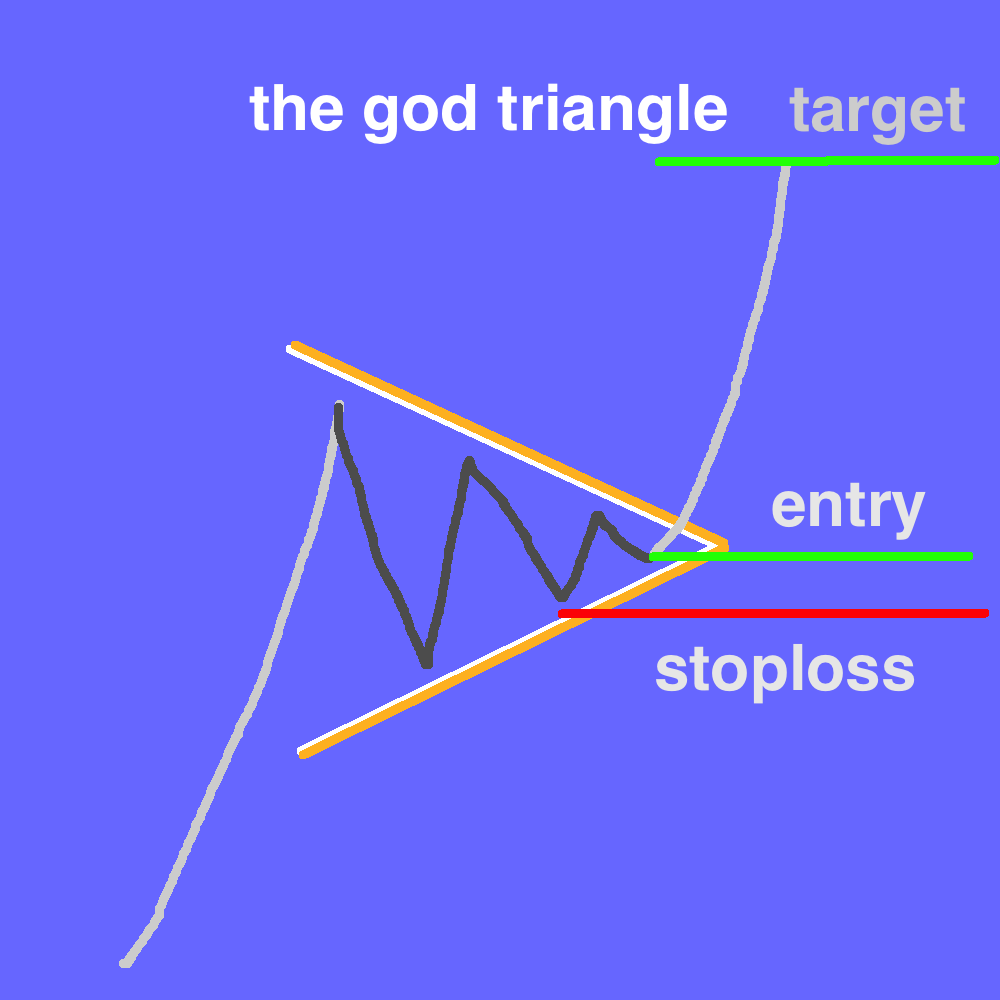
the god triangle gives you the best of both worlds.
for more trading tips & tutorials join the nearly 5,000 others learning today!
https://t.co/DFOPJPdZKd
More from Crypto


Back with another #FreeLoveFriday. Last time, we covered how Mastercoin/@Omni_Layer pioneered digital asset issuance on blockchains. Today, let’s discuss @Chainlink and the vital role it plays in connecting blockchains to the real world.
I have said repeatedly that digital asset issuance is the killer application for blockchains. The next frontier is bringing real world assets to networks like @AvalancheAVAX, but we often face a significant problem:
Namely, how do you get data from the real world onto blockchains and into applications running on them? More critically, how do you achieve that securely and transparently in real-time? Smart contracts are tamper-proof, but they're only as reliable as their input data.
Enter ChainLink in September 2017, with a whitepaper outlining a vision for a decentralized network of “oracles,” entities that inject facts from the external world into blockchains in a suitable format for smart contracts.
Until ChainLink, oracles were trusted and centralized. This is a huge problem for high-value assets and smart contracts. High value projects, such as @CelsiusNetwork, @synthetix_io, @Aaveaave and others depend critically on oracle data.
Back with another #FreeLoveFriday. My first thread focused on what I love about Bitcoin, and features we borrowed for @AvalancheAVAX. Today, let's focus on @Omni_Layer, or as OGs knew it, Mastercoin https://t.co/fXFgmaeUEz
— Emin G\xfcn Sirer (@el33th4xor) January 15, 2021
I have said repeatedly that digital asset issuance is the killer application for blockchains. The next frontier is bringing real world assets to networks like @AvalancheAVAX, but we often face a significant problem:
Namely, how do you get data from the real world onto blockchains and into applications running on them? More critically, how do you achieve that securely and transparently in real-time? Smart contracts are tamper-proof, but they're only as reliable as their input data.
Enter ChainLink in September 2017, with a whitepaper outlining a vision for a decentralized network of “oracles,” entities that inject facts from the external world into blockchains in a suitable format for smart contracts.
Until ChainLink, oracles were trusted and centralized. This is a huge problem for high-value assets and smart contracts. High value projects, such as @CelsiusNetwork, @synthetix_io, @Aaveaave and others depend critically on oracle data.





You May Also Like



Ivor Cummins has been wrong (or lying) almost entirely throughout this pandemic and got paid handsomly for it.
He has been wrong (or lying) so often that it will be nearly impossible for me to track every grift, lie, deceit, manipulation he has pulled. I will use...

... other sources who have been trying to shine on light on this grifter (as I have tried to do, time and again:
Example #1: "Still not seeing Sweden signal versus Denmark really"... There it was (Images attached).
19 to 80 is an over 300% difference.
Tweet: https://t.co/36FnYnsRT9

Example #2 - "Yes, I'm comparing the Noridcs / No, you cannot compare the Nordics."
I wonder why...
Tweets: https://t.co/XLfoX4rpck / https://t.co/vjE1ctLU5x

Example #3 - "I'm only looking at what makes the data fit in my favour" a.k.a moving the goalposts.
Tweets: https://t.co/vcDpTu3qyj / https://t.co/CA3N6hC2Lq

He has been wrong (or lying) so often that it will be nearly impossible for me to track every grift, lie, deceit, manipulation he has pulled. I will use...
... other sources who have been trying to shine on light on this grifter (as I have tried to do, time and again:
Ivor Cummins BE (Chem) is a former R&D Manager at HP (sourcre: https://t.co/Wbf5scf7gn), turned Content Creator/Podcast Host/YouTube personality. (Call it what you will.)
— Steve (@braidedmanga) November 17, 2020
Example #1: "Still not seeing Sweden signal versus Denmark really"... There it was (Images attached).
19 to 80 is an over 300% difference.
Tweet: https://t.co/36FnYnsRT9
Example #2 - "Yes, I'm comparing the Noridcs / No, you cannot compare the Nordics."
I wonder why...
Tweets: https://t.co/XLfoX4rpck / https://t.co/vjE1ctLU5x
Example #3 - "I'm only looking at what makes the data fit in my favour" a.k.a moving the goalposts.
Tweets: https://t.co/vcDpTu3qyj / https://t.co/CA3N6hC2Lq









![Peter McCormack [Jan/3\u279e\u20bf \U0001f511\u220e]](https://pbs.twimg.com/profile_images/1524287442307723265/_59ITDbJ_normal.jpg)