Breakout Trading is the most underrated trading technique in the trading community!

Every trader (intraday, swing, positional, or scalper) should know how to differentiate between a genuine breakout and a false breakout.

Do you know why?

Read this thread!

(1/N)

It’s important to understand two herds that exist in the market:

1. Smart Money &

2. Dumb Money

‘Smart Money’ refers to big sharks who have money & information power who give direction & momentum.

‘Dumb Money’ refers to retail traders who often try to make quick money.

(2/N)
You should know one secret now.

Participation from smart money creates a "genuine breakout."

And the absence of smart money participation results in a "false breakout."

Hence, it is always a good idea to follow smart money (by knowing real or false breakout)

(3/N)
What is Breakout?

As per Investopedia

“A breakout is a stock price moving outside a defined support or resistance level with increased volume. A breakout trader enters a long position after the stock price breaks above resistance.”

(4/N)
The price broke the resistance trend line with high volumes in this image.

Similarly, few recognize it as a breakdown if the price breaks the support trend line.

To keep it simple, we will focus only on the breakout.

(5/N)
What is False Breakout?

As per Investopedia -

“A failed break occurs when a price moves through an identified level of support or resistance but does not have enough momentum to maintain its direction.”

(6/N)
But this definition of Breakout Trading doesn't hold good in many cases:

Look at some examples:

Example 1 - HDFC

(7/N)
Example 2 - Rain Industries
Example 3 - Kotak Mahindra Bank

(8/N)
Then how to Differentiate a "Real Breakout" from a "False Breakout"?

We need 4 parameters:

1) A Big Breakout Candle

2) Quick Time (the price shouldn’t move in small candles after breakout)

3) Absence of Selling

4) Good Volume

(9/N)
1) A Big Breakout Candle

The breakout candle should be big as compared to the previous candle before the breakout.

It indicates the presence of "smart money"

(10/N)
2 - Quick Time

A breakout should come in one quick candle (previous step).

It indicates the absence of "smart money"

A breakout with a couple of small candles is not good (as shown below)

(11/N)
3 - Absence of Selling

Breakout candle should have no selling wick or the selling wick should be less than 20% of the breakout candle.

It indicates smart money is keen to carry the position!

(12/N)
4 - Good Volume

Good volume indicates the presence of smart money.

(13/N)
Below are some examples which satisfy all these conditions:

Example 1
Example 2
Example 3

These charts displayed these four characteristics at the time of breakout, and hence, the price showed a good move on the upside later.

There is a high probability of a good upside move if a chart displays all these characteristics during the breakout

(14/N)
Trade Management

As a trader, before entering any trade, you should know the bare minimum below 4 aspects:

- Entry
- Stop-Loss
- Profit Booking Level
- Risk per Trade

(15/N)
That's a wrap!

If you enjoyed this thread:

1. Follow me
@indraziths

for more threads on the stock market trading

2. RT the tweet below to share this thread with your audience

3. You can also check my book on Breakout Trading

https://t.co/XnMi7MuAGD
One can use the free screener to shortlist all the breakout stocks from NSE segment every day

Please read all the instructions carefully before using it

https://t.co/3teN7JLDMs

More from Indrazith Shantharaj

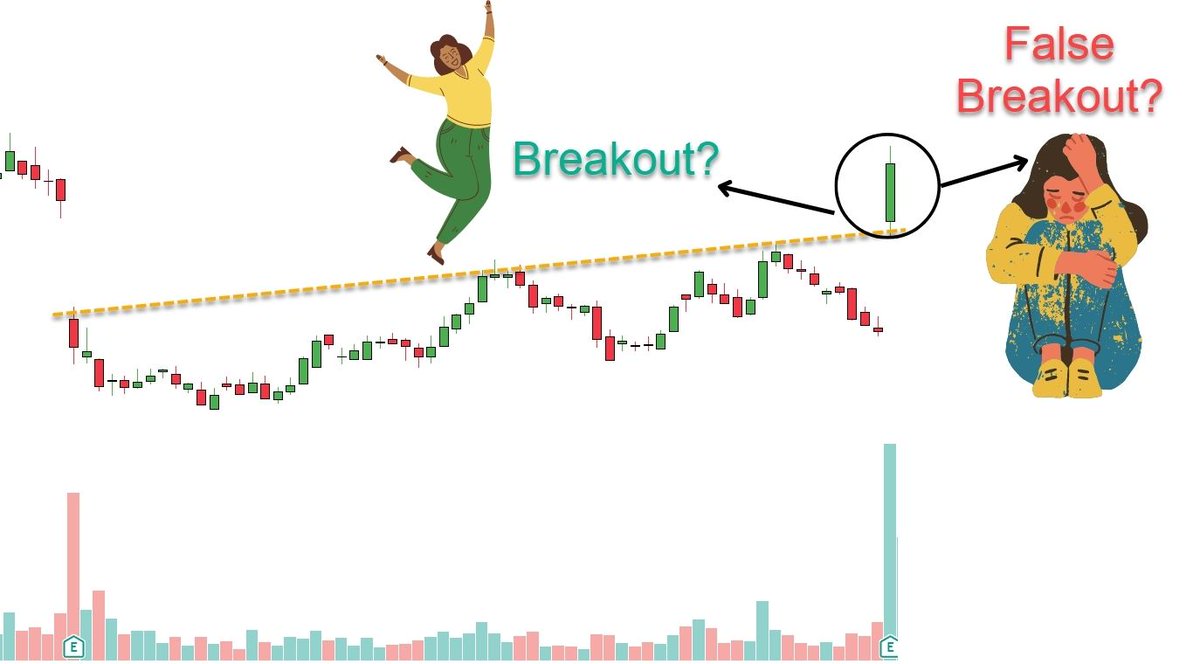
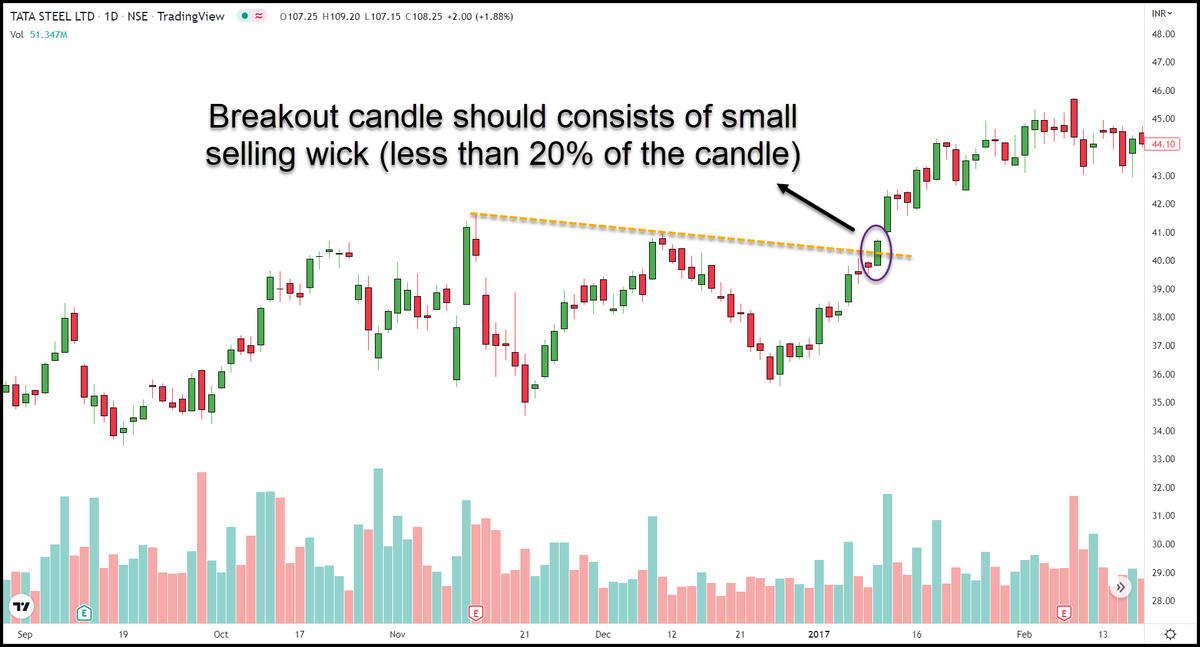
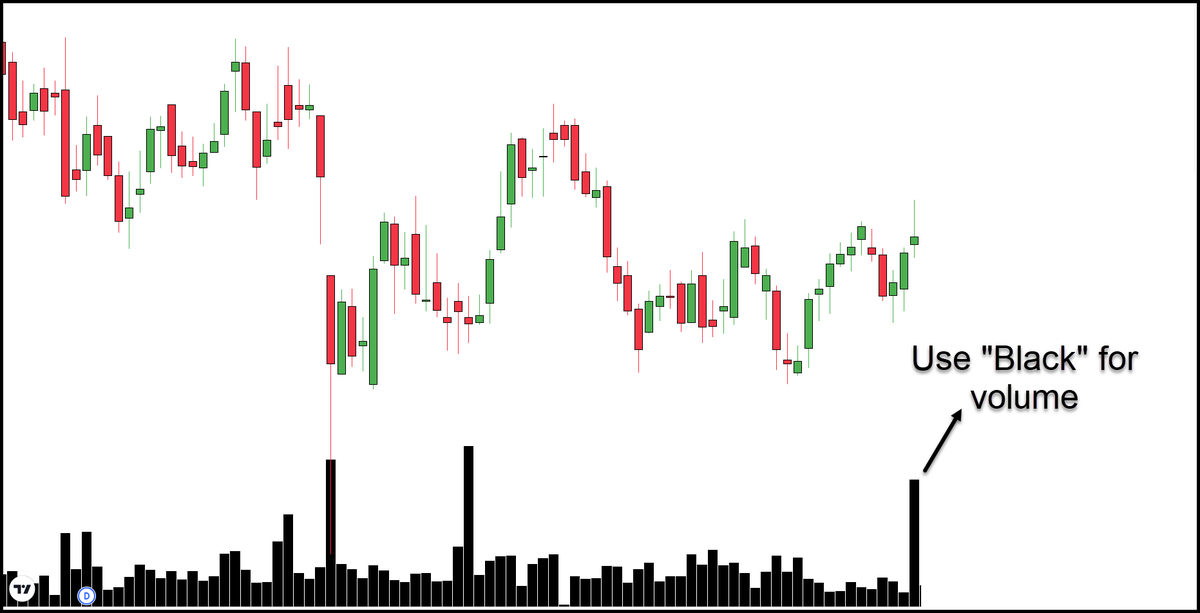
"VOLUME is the ultimate Trading cheat code" PART 2

Please read the FIRST Thread Before Reading this!

https://t.co/IV1HrDlzqk

#StockMarket #stock #volumeintrading


#1 Volume Color Can Create a False Illusion

At first look, it looks like a big volume spike.

But if you notice the price candle, it has a big selling wick.

It indicates "SELLING PRESSURE" is high at that time.


We can easily avoid this false impression using the "BLACK" color code across all the volume bars.

Now your mind doesn't assume it is a bullish volume spike!

(If you don't want to use the black color, then view the chart without getting any bias based on the volume color)


#2 Analyze Each Volume Spike Carefully

In this image, the price is breaking the resistance trendline.

How do you say whether it is a genuine breakout or false breakout (from a volume perspective)?


Observe the major Volume Spikes.

A is Bullish (Price moved upside on the next day)

B is Bearish (Price fell on the next day)

C is Bearish (Price moved sideways and fell)

D is Bearish (Price fell on the next day)

So High Probability of FALSE BREAKOUT!

You May Also Like