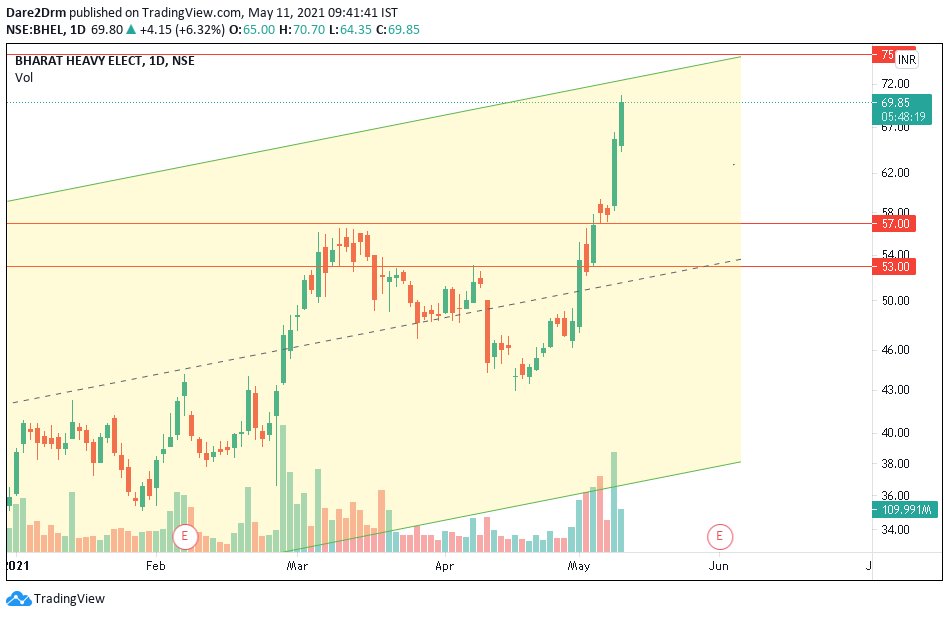
#Bhel up 5% since post
It crossed 63, now price action important, if sustains above 63, can possibly head towards 69-75 zone
RSI looking bullish
Not a trading call , academic post https://t.co/0IAjXZ5C88

#BHEL monthly chart, if the stock is able to trade above 60-63 zone, we may see significant upmove in this stock, Monthly RSI is 50+ & moving up.
— Techno Prince (@Trader_souradep) May 10, 2021
Not a trading call, academic post pic.twitter.com/VuBoKJvbmn
More from Techno Prince


More from Bhel

#BHEL 57 to 73 in 4 trading days🛩️🛩️.
Around 73 / 74 - is the first target - next targets around 110.
Remember :Keeping a stop is always important if one is trading.
@caniravkaria https://t.co/ViHbzJTfQ6
Around 73 / 74 - is the first target - next targets around 110.
Remember :Keeping a stop is always important if one is trading.
@caniravkaria https://t.co/ViHbzJTfQ6
#BHEL looks good for targets of 74+ https://t.co/jrRyXc5FLL pic.twitter.com/KWkzeHSs0D
— Dare2Dream (@Dare2Dr10109801) May 6, 2021


#Bhel - Falling from 79.55 now at 55
Chart wise labeling for 1,2,i,ii for now - counts invalid if falls further to 38. In that case will take a fresh look.
#Nifty #Elliotwave #Chart https://t.co/2mvKfAs3wA
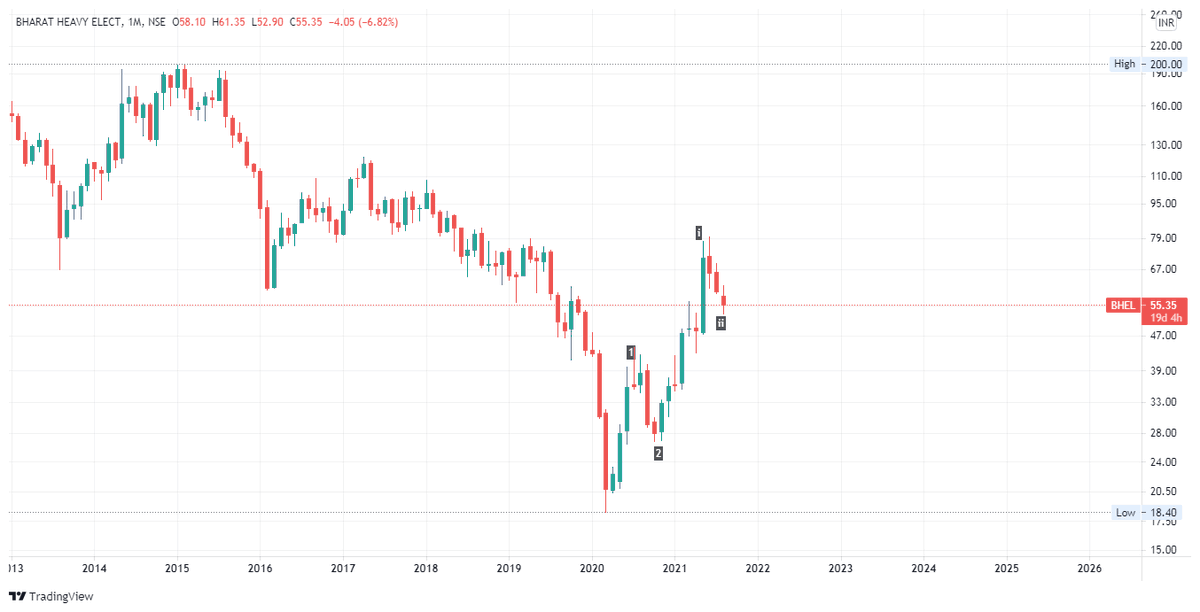
Chart wise labeling for 1,2,i,ii for now - counts invalid if falls further to 38. In that case will take a fresh look.
#Nifty #Elliotwave #Chart https://t.co/2mvKfAs3wA
Holding 29, major wave 2 looks over. Will you believe if I say ATH will come? But let's go step my step - 80-130-200 \U0001f600#Bhel pic.twitter.com/3KPCYeDoDp
— Harsh Mehta (@_Harsh_Mehta_) February 4, 2021


You May Also Like

Krugman is, of course, right about this. BUT, note that universities can do a lot to revitalize declining and rural regions.
See this thing that @lymanstoneky wrote:
And see this thing that I wrote:
And see this book that @JamesFallows wrote:
And see this other thing that I wrote:
One thing I've been noticing about responses to today's column is that many people still don't get how strong the forces behind regional divergence are, and how hard to reverse 1/ https://t.co/Ft2aH1NcQt
— Paul Krugman (@paulkrugman) November 20, 2018
See this thing that @lymanstoneky wrote:
And see this thing that I wrote:
And see this book that @JamesFallows wrote:
And see this other thing that I wrote: