Most of us would confuse it with Relative Strength Index (RSI) but Relative Strength is a different indicator.
We have already covered about "Uses of RSI" in below thread👇
https://t.co/oTOrW7joNI One can go through this if you haven't.
2/22
Now coming to Relative Strength (RS).
It is basically a strategy used in momentum investing which shows strength or weakness between two asset classes (two stocks, index, commodity).
One can read about this in below link👇
https://t.co/Jb1lH0l90H 3/22
As of now, I am using this indicator on .@tradingview platform.
It's free and one can add it in their Tradingview account as well, using this link👇
https://t.co/FxCjJFsNOG There are multiple variants in this as well. Some traders use multiple time frame RS.
4/22
RS basically compares returns of one stock/index with the returns of benchmark stock/index at a particular time horizon.
Let's say, I want to analyze TCS and Benchmark Index is Nifty.
5/22
TCS gave 13% returns and Nifty gave returns of 10% in 1 month. Then RS would of TCS would be 13%-10% ~ 3% (approximated).
Actual value/forumula be ((1+13%)/(1+10%)-1) = 2.7%.
This means TCS had outperformed Nifty in one month by 2.7%.
5/22
Let's see how this indicator looks and how it functions.
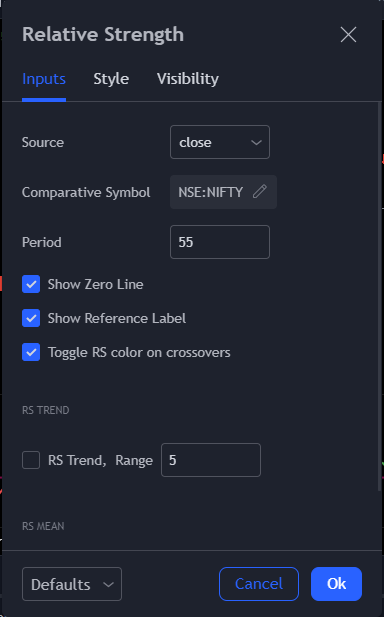
This is the general inputs for RS.
Two important inputs here are:
1. Comparative Symbol- This means which would be the benchmark index/stock one want's to compare their stock/index.
6/22
In Indian stock market, use Nifty as a benchmark as it includes all the major sectors.
2. Period: This is the time horizon over which one wants to compare the strength or weakness.
General period that is used is:
55- (3 months)
123- (6 months)
252 - (1 year)
7/22
Comparative Symbol and Period are highly customizable and use the values that suit your style.
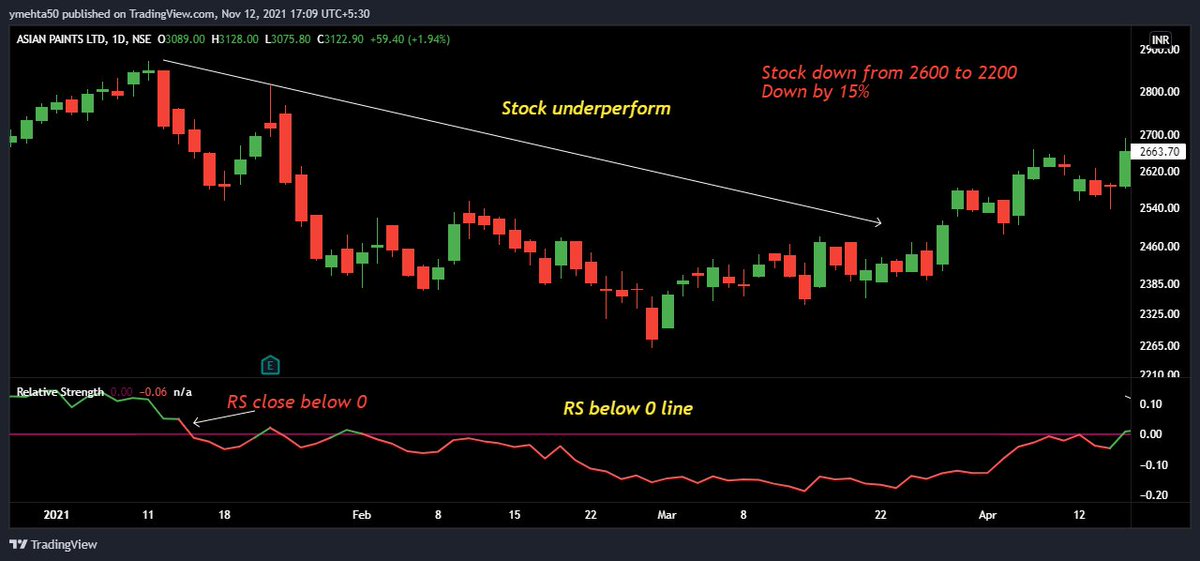
This is a sample RS chart of Asian Paints v/s Nifty.
Green RS means stock has outperform and Red RS indicates underperformance.
Pink line is 0 line which is highly important.
8/22
General definition of RS says:,
If RS line is above 0, then it shows stock will outperform and if RS is below 0, then it shows stock will underform.
Let's look at the same example:
When RS line closed below 0 line, Asian Paint stock went down from 2600 to 2200 (-15% down).
9/22
Similarly, for bullish setup.
When RS closes above 0 line, price of Asian Paints moved up from 2550 to 3000 (18% up).
Simple Rule of RS is:
1. Buy if RS > 0
2. Sell/Exit if RS < 0
This looks easy, but this is not that easy.
10/22
Above setup that was shared was only when RS worked well.
There can be a lot of whipsaws in real life and using RS as a standalone will give you a lot of entry and exit in a stock. This will lead to minor loss plus additional trading cost.
What can be done now?
11/22
One of the setup that I am using and practicing based on Relative Strength was gifted by
@vivbajaj sir.
One can watch the video as he had explained everything about simple Relative Strength setup in detail👇
https://t.co/kNpK9M4frd 12/22
Setup is simple. Use following indicators:
1. Relative Strength (RS) - Period = 55, Benchmark = Nifty
2. Supertrend - Default Setting
3. Relative Strength Index (RSI) - Default Setting
Price Action is used as it is the supreme indicator in trading.
13/22
Buying Setup (Daily Time Frame):
1. RS above 0
2. Price above Supertrend
3. RSI > 50
Once all these conditions satisfy, then wait for price action confirmation.
Price should give a breakout on closing basis above previous swing high with good volumes.
14/22
Exit Setup:
Use 2 hour time frame chart.
If any two of the buying condition gets violated on closing basis, then exit immediately.
Why exit is done based on 2 hour chart?
Reason is fear in market spreads faster, so if lower time frame is bearish then exit.
15/22
Re-enter again if on 2 hours time frame setup becomes bullish and daily setup is also bullish.
Daily and 2 hours combination is for short-term trading.
One can use Weekly and Daily combination for positional trading.
16/22
Let's see some case/examples now:
Infosys (daily chart)
After satisfying all the conditions, entry got triggered at 960 and price rallied from 960 to 1120.
Up by 16% in the short term.
17/22
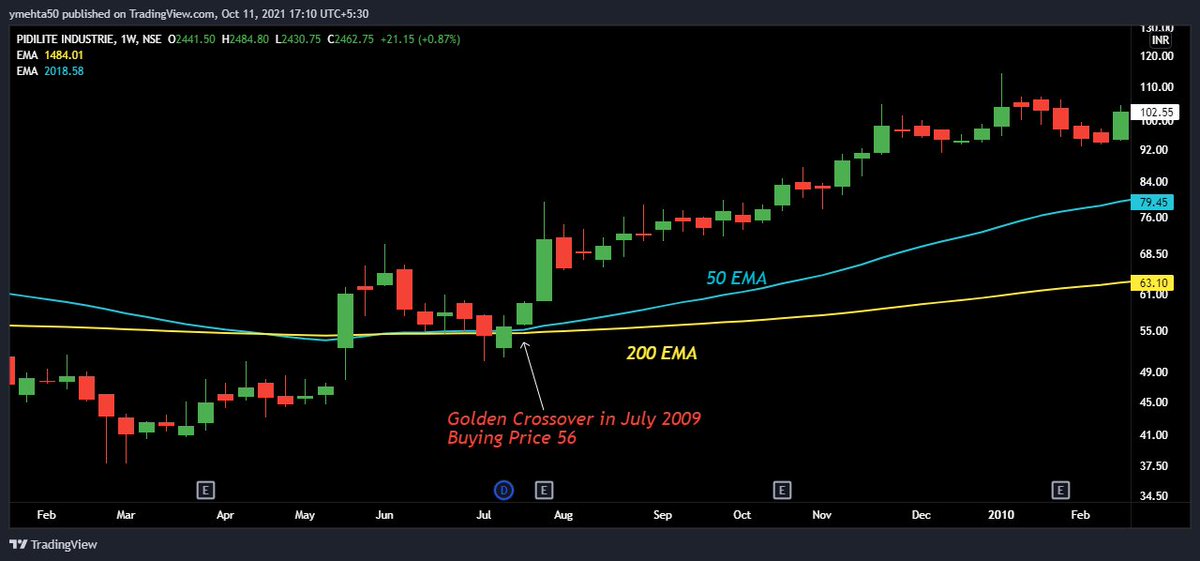
Second example is Pidilite Industry.
After fulfilling all the conditions, entry got triggered at 1930 and price rallied from 1930 to 2220.
Up by 12% in the short term.
18/22
One example of Positional Trading Setup:
Laurus Lab (Weekly Chart)
All the conditions got satisfied and price moved from 100 to 530. Stock up by 430%.
There would be many examples for this, so I would suggest to check this setup on other stocks and index chart as well.
19/22