Sharing one idea I found useful for paper writing:

Do NOT ask people to solve correspondence problems.

Some Dos and Don'ts examples below:

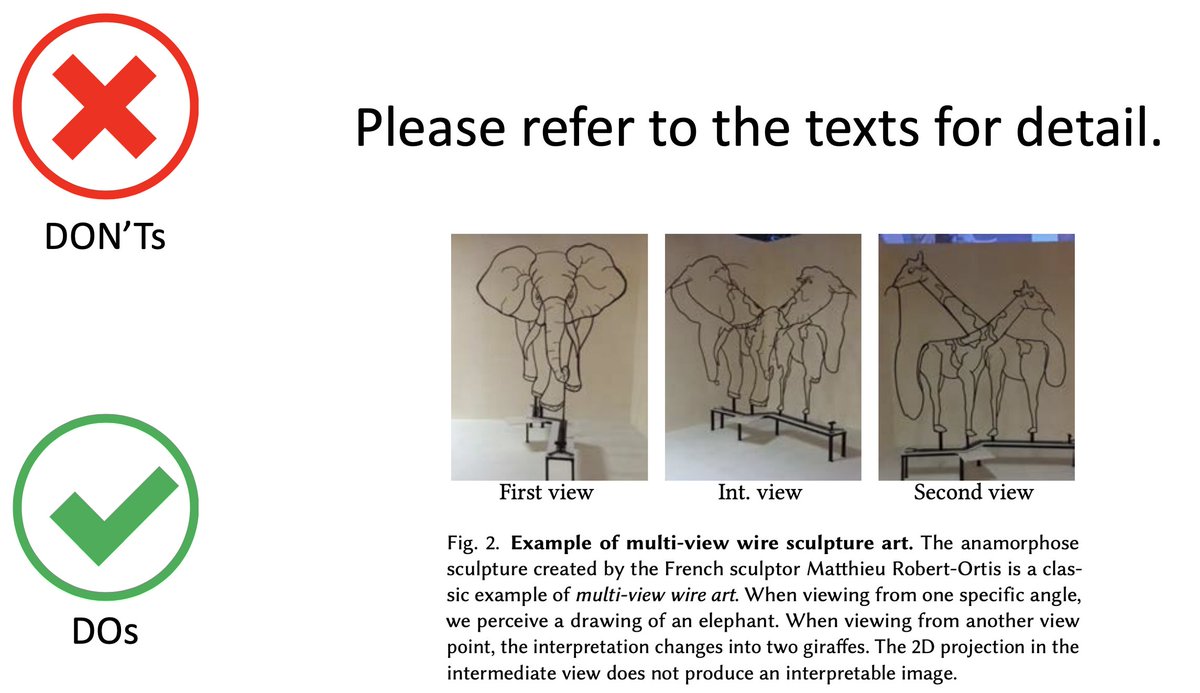
*Figures*: Don't ask people to match (a), (b), (c) ... with the descriptions in the figure caption.

*Figure caption*

Use "self-contained" caption. It's annoying to dig into the texts and match them to the figures. Ain't nobody got time for that! ⌚️

Also, add a figure "caption title" (in bold fonts). It allows readers to navigate through figures quickly.
*Notations*

Give specific, meaningful names to your math notations. For example, the readers won't need to go back and forth to figure what each term means.
*Which*

I found that many of my students love to use "which" in their sentences. I hate it ... because I often cannot figure out what exactly "which" refers to. Break it down into simple sentences and spell out what that subject of the sentence is.
*Respectively*

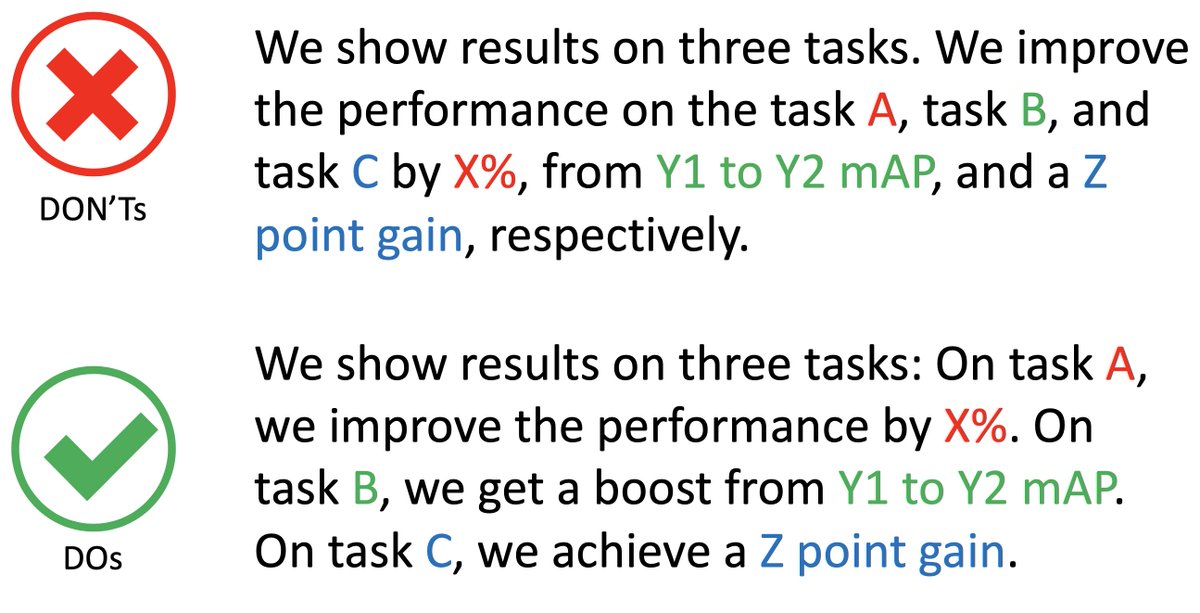
It's hard to parse which corresponds to which in the sentence that ends with "respectively" (have to solve a long-range correspondence problem). Break them them so that one sentence talks about one thing.
*Citations*

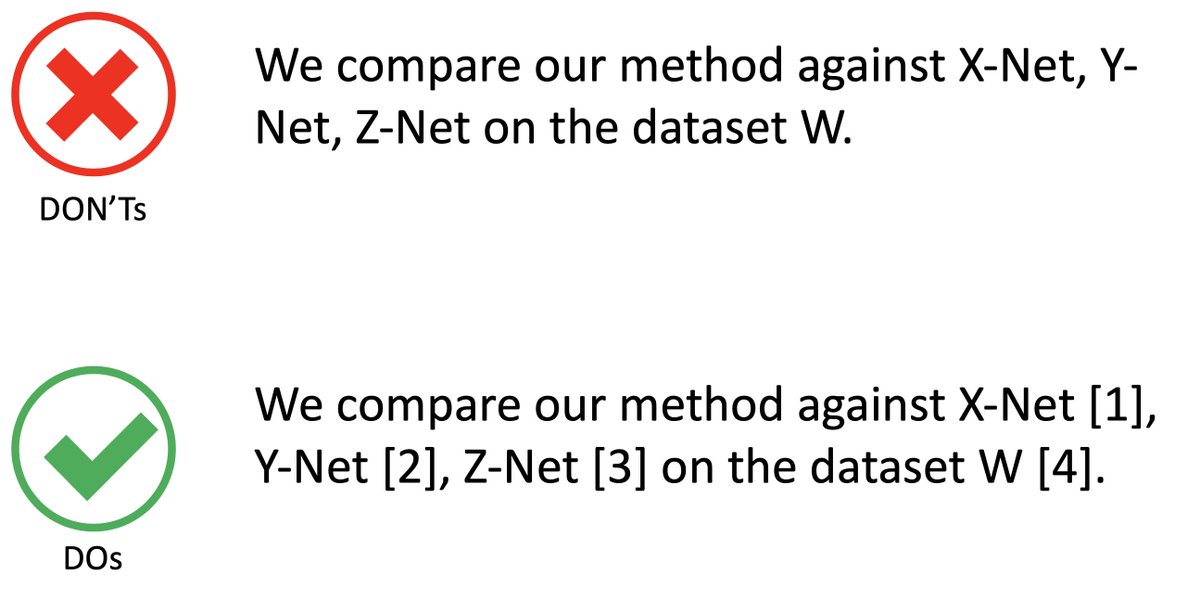
People like to use many acronyms for their methods. It may be hard for readers to memorize/match which method/dataset/metric you are referring to. Adding citations is an easy way to fix this.
*Names for notations*

When using notations in the sentences, mention their "names" as well. The readers won't need to flip through your papers to look up what these notations mean.
*Connect figures with equations, notations, and sections*

I view the overview figure in a paper a centralized hub that connects all the important equations, notations, and sections in one place. This makes it easy for people to understand how everything fits together.
*Tables*

Factorize the variants/attributes of different methods so that it becomes clear to compare one with another.
*One table, one message*

Decompose your big table so that each table conveys exactly one thing. This avoids people from having to compare results from distant rows. Having multiple smaller tables gets the point across easier. (Don't worry about the redundancy.)
*Group subfigures*

Don't ask readers to figure out the grouping (b-c) and (d-e) in the caption when you explicitly group them.

How to create underbracket? Ex:

$\underbracket[1pt][2.0mm]{\hspace{\FIGWIDTH}}_%
{\substack{\vspace{-2.0mm}\\
\colorbox{white}{(a) Input}}}$
*Parallelism*

When applicable, use repetitive grammatical elements in your sentence. It helps the readers to easily parse the parallel concepts you want to convey.
*Table organization*

Merge tables sharing the same structure. Label the metric (the larger/smaller the better) with up-arrow and down-arrow so that your readers don't need to look them up.
*Shape attributes*

Leverage the shape attributes (color, thickness) to encode the message.

Also, use a deemphasized image in the background to avoid mental matching.

More from All

You May Also Like

A THREAD ON @SarangSood

Decoded his way of analysis/logics for everyone to easily understand.

Have covered:
1. Analysis of volatility, how to foresee/signs.
2. Workbook
3. When to sell options
4. Diff category of days
5. How movement of option prices tell us what will happen

1. Keeps following volatility super closely.

Makes 7-8 different strategies to give him a sense of what's going on.

Whichever gives highest profit he trades in.


2. Theta falls when market moves.
Falls where market is headed towards not on our original position.


3. If you're an options seller then sell only when volatility is dropping, there is a high probability of you making the right trade and getting profit as a result

He believes in a market operator, if market mover sells volatility Sarang Sir joins him.


4. Theta decay vs Fall in vega

Sell when Vega is falling rather than for theta decay. You won't be trapped and higher probability of making profit.