
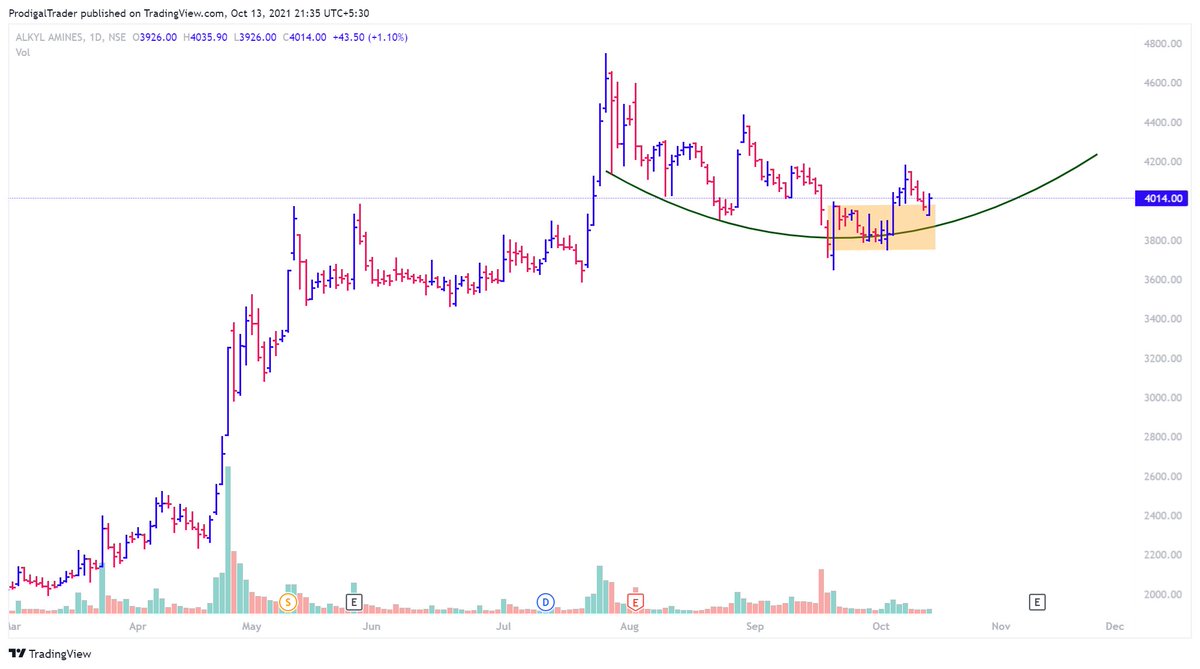
#alkylamine
Chart speaks a lot here !!!
#StockToWatch #StockMarket #nse
More from ProdigalTrader
Few concepts upon which day trading systems can be built upon
https://t.co/3eAoEqM7QQ up trending market look for pin bar with good volume
2.Rsi divergence and macd histogram divergence both at the same time on 3 min chart
https://t.co/qrAH9PZ6D3 = Low (15min)
1/7
4.ORB with 15 min candle stick along with support and resistance of previous 5 days
5.Pullbacks in Strong momentum (wide range candles + Volume) stocks
6.ORB with volatility contraction and then wide range candle breakout with volume expansion
2/7
7.Fakeout like spring and Upthrust for entry pullback with low volume
8.CPR analysis with standard pivots
9.PDH/PDL breakout with volume, vwap and RSI confirmation
3/7
10.Horizontal support/resistance from HTF and confirmation of acceptance or rejection in lower timeframe as reversal candlestick patterns with volume confirmation
https://t.co/75kykbExlg writing data and Put Writing data in correlation with price action
4/7
12.Pivots (Fibonacci) and Price action with volume activity
13.Ichimoku set ups with previous day NR4/NR7 scrips with pivots and volume as trading tools
https://t.co/JcwqOZS5L4 and rejections on 100/200 ema
15.EMA20 and rsi divergence with daily trend structure
5/7
RSI is an oscillator which is set to fluctuate between 0 and 100. Adding an MA to it would give a perspective of its location, at the max. Its never support or resistance
Aneesh ji, Like in PA we have undercut and reclaim of some major MA some significance, does it have any significance in RSI?
— Prakhar (@StocksbyPrakhar) May 12, 2022


