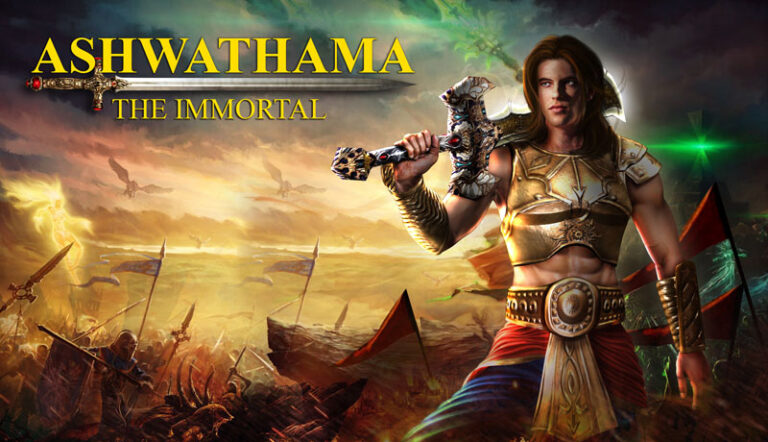
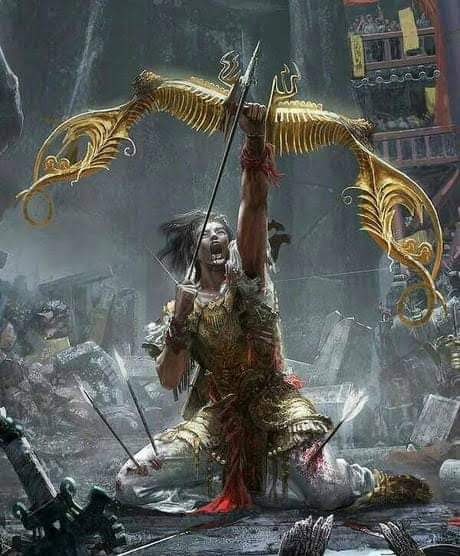
In the Hindu Epic Mahabharata, Ashwatthama or Drauni is the son of Dronacharya and the grandson of the Bharadwaj Rishi. Ashwatthama was a Maharathi who fought alongside the Kauravas against the Pandavas in the Kurukshetra War.
According to the Mahabharata, Ashwatthama means the sacred sound associated with the sound of a horse. He was given the name Ashwatthama because when he was born, he cried like a horse.
Here are some interesting facts about Ashwatthama.
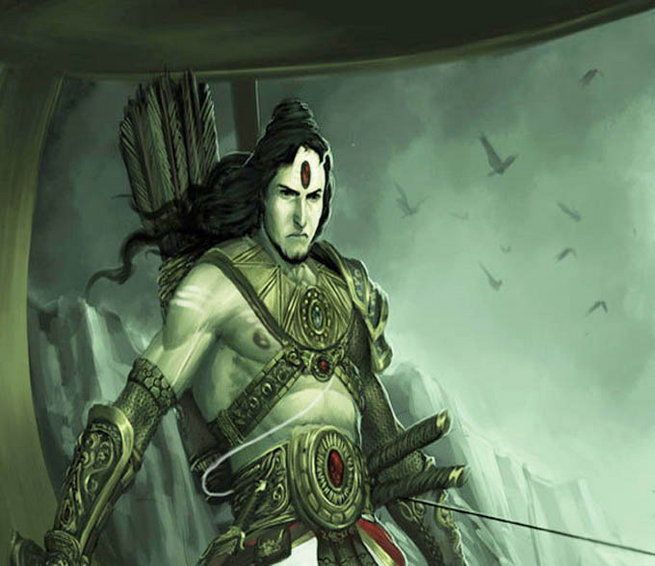
- Ashwathama is one of the Ashta Chiranjeevi, Eight Immortals. Ashwatthama was born with a jewel on his forehead, giving him power over all living beings lower than humans. The jewel protected him from hunger, thirst, and fatigue.
- His strength is almost equal to Arjuna’s, especially in archery. Among the Kuru princes, he was good friends with Duryodhan, the eldest son of Dhritarashtra. They both have jealousy towards the Pandavas.
Duryodhan felt that Yudhisthir was his obstacle in inheriting the throne of Hastinapur, while Arjun’s talent made Ashwatthama jealous because he felt that his father’s love had been divided. After all, Arjuna was Drona’s favourite student.