SteveeRogerr Authors Dr. Simon ツ
7 days
30 days
All time
Recent
Popular

1/ Happy to announce that we have submitted our #paper ‘Bayes Lines Tool (BLT) - A SQL-script for analyzing diagnostic test results with an application to SARS-CoV-2-testing’.
In this ⬇️thread⬇️, I will explain why our tool is that powerful for decision makers. #UnbiasedScience
2/ In the meantime, the submitted paper is available on the preprint platform @zenodo_org. Factual criticism is highly desired and encouraged. The publication itself presents a seminal Bayesian calculator, the Bayes Lines Tool (BLT). (Petje af, @waukema!)
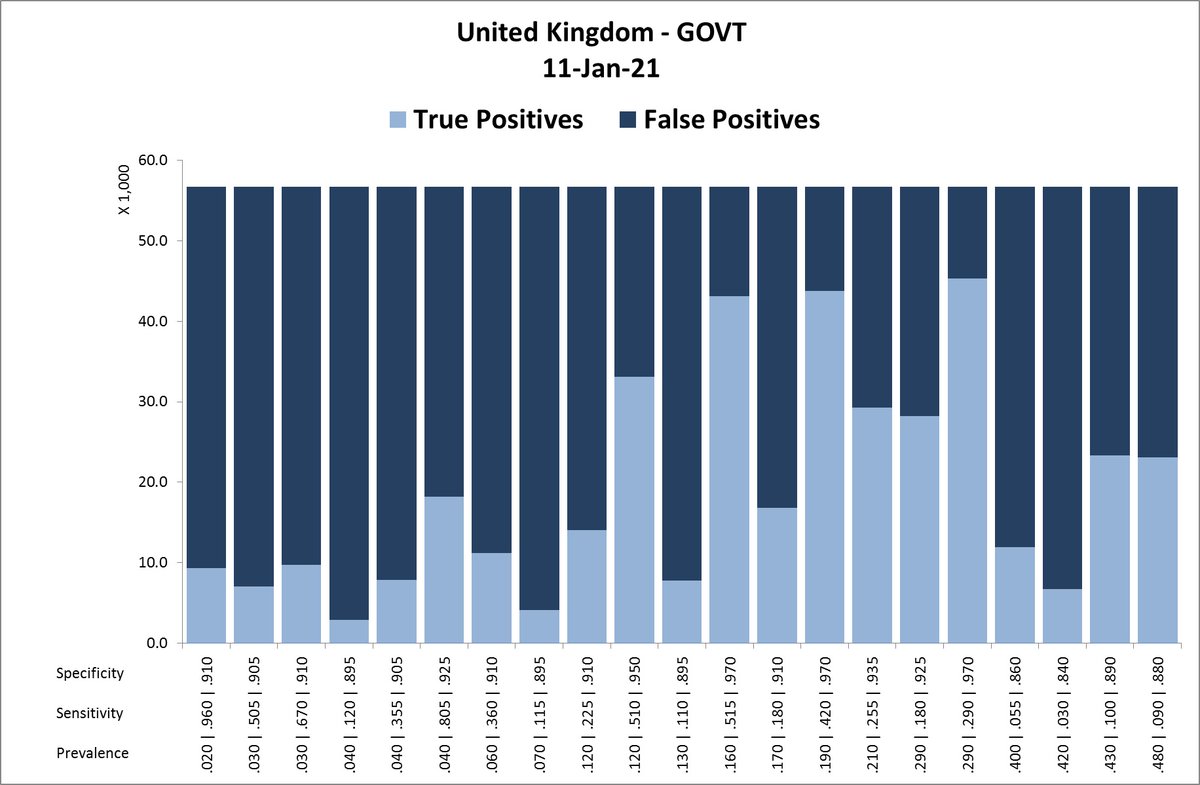
3/ The Bayes Line Tool (available on https://t.co/jIomSIxOd9) is able to back-solve disease #prevalence, test #sensitivity, test #specificity, and therefore, true positive, false positive, true negative and false negative numbers from official governmental test outcome reports.
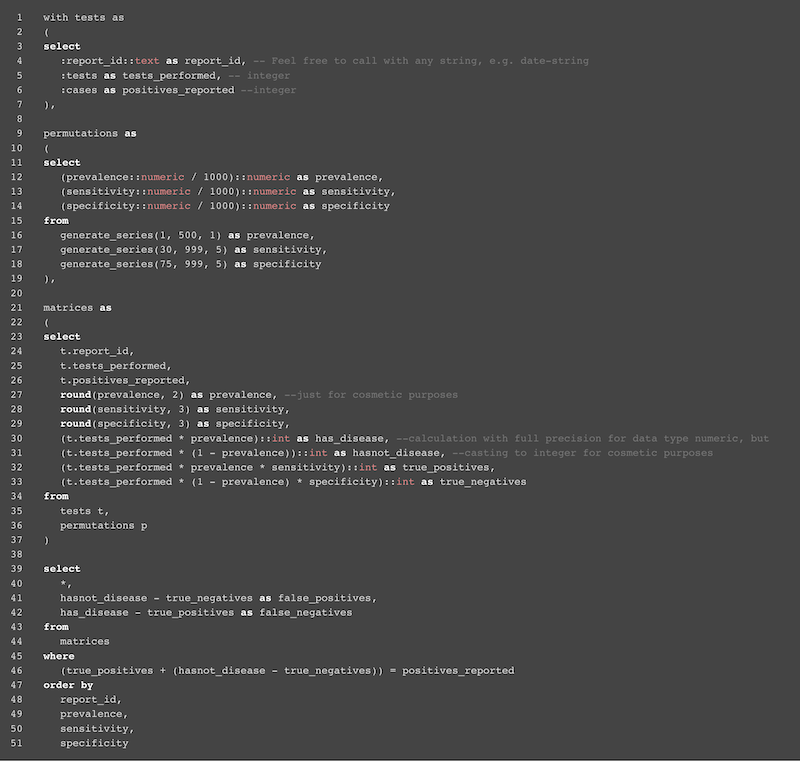
4/ This is done by creating confusion matrices with four variables. Namely: TP, FP, TN, FN. In order to calculate the matrices, we need prevalence, specificity, and sensitivity as well as the number of people that got tested (within a given period) and the number of positives.
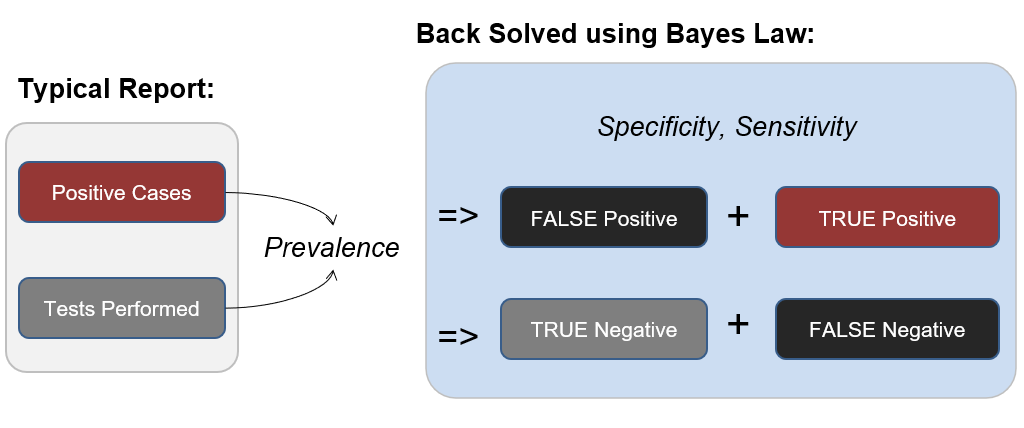
5/ The number of positives and the number of tests are given by the government. Prevalence, specificity, and sensitivity are unknown. So we assume any combination of them ranging from 0-99%. These three combinations can amount up to #millions of #combinations.
In this ⬇️thread⬇️, I will explain why our tool is that powerful for decision makers. #UnbiasedScience
2/ In the meantime, the submitted paper is available on the preprint platform @zenodo_org. Factual criticism is highly desired and encouraged. The publication itself presents a seminal Bayesian calculator, the Bayes Lines Tool (BLT). (Petje af, @waukema!)
3/ The Bayes Line Tool (available on https://t.co/jIomSIxOd9) is able to back-solve disease #prevalence, test #sensitivity, test #specificity, and therefore, true positive, false positive, true negative and false negative numbers from official governmental test outcome reports.
4/ This is done by creating confusion matrices with four variables. Namely: TP, FP, TN, FN. In order to calculate the matrices, we need prevalence, specificity, and sensitivity as well as the number of people that got tested (within a given period) and the number of positives.
5/ The number of positives and the number of tests are given by the government. Prevalence, specificity, and sensitivity are unknown. So we assume any combination of them ranging from 0-99%. These three combinations can amount up to #millions of #combinations.