
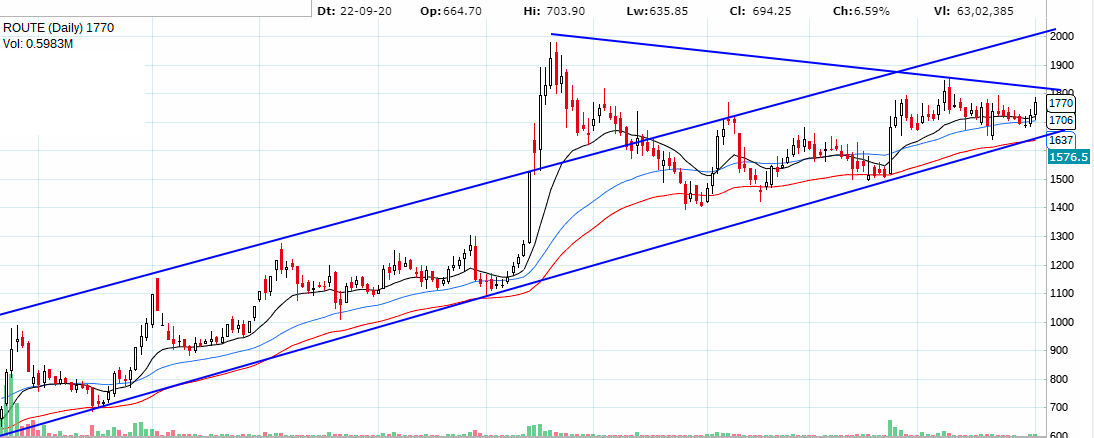
Almost every 6 year, Chennai Petro falls to 80 odd level, rises to 460-480 and falls again to touch same level. It happened in 2009, happened in 2015, 2020 it just reversed from 80 and result also to assist!! Can we see cycle playing out again?
— Ameya (@Finstor85) July 25, 2020
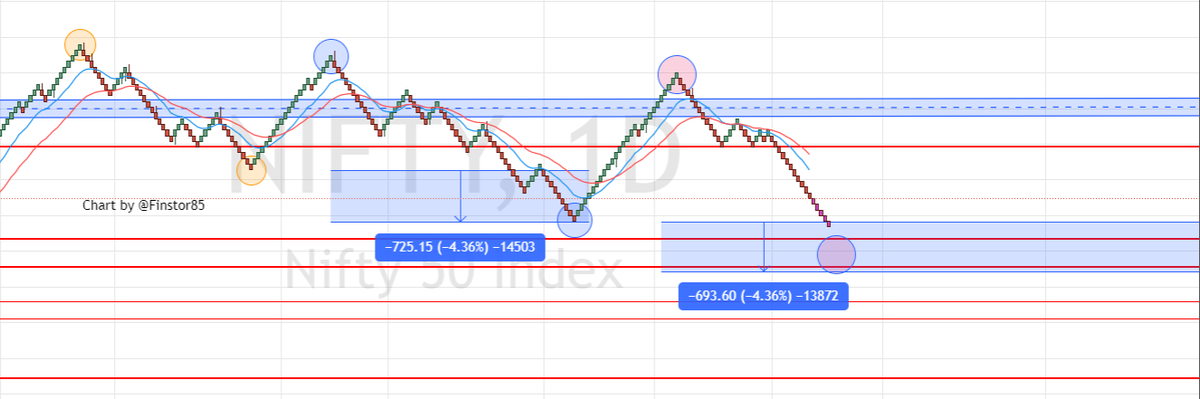
If we are to continue LH-LL setup & break 16666 on daily we will finally complete this drag near 15214. I am not bearish. In fact, this should give amazing opportunity to buy. Until then 16666-17300 continue to provide L-H range for traders. pic.twitter.com/tfIq00VJmZ
— Ameya (@Finstor85) May 2, 2022
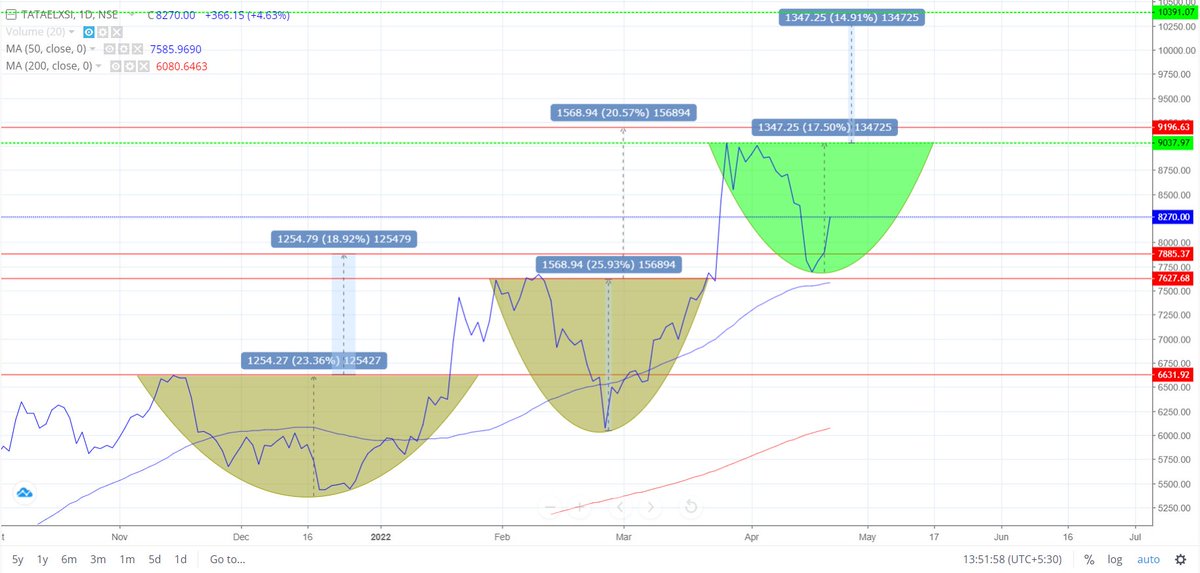
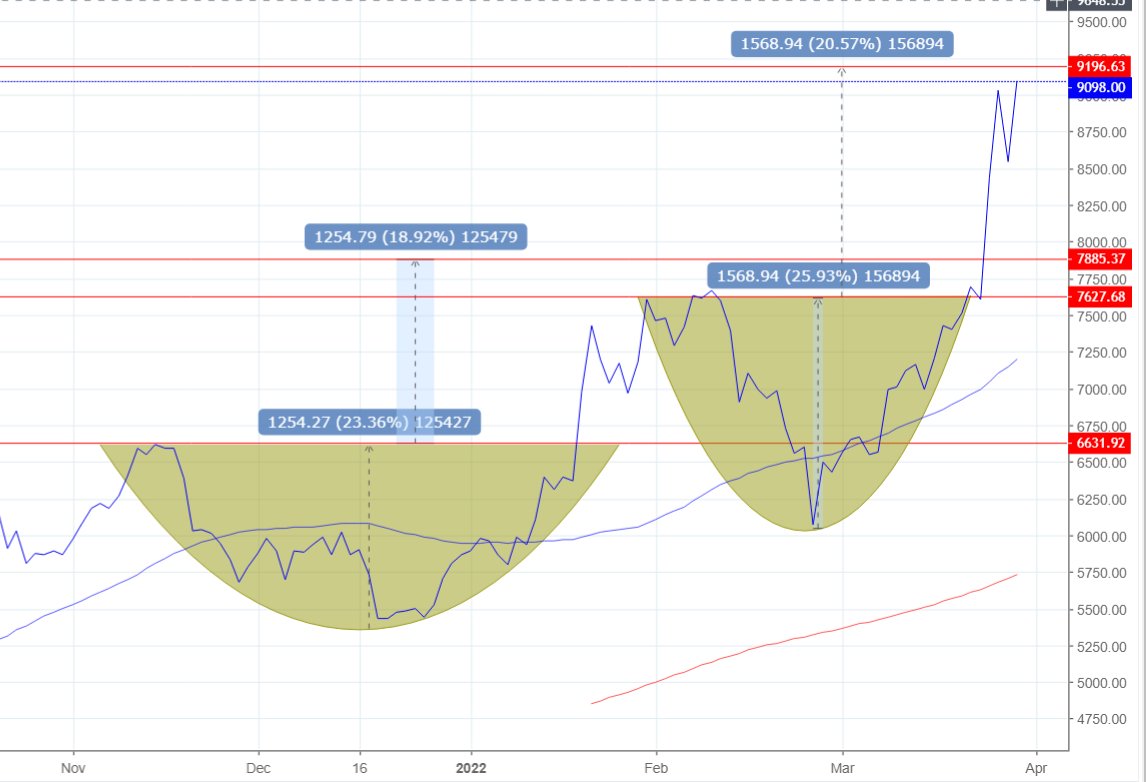
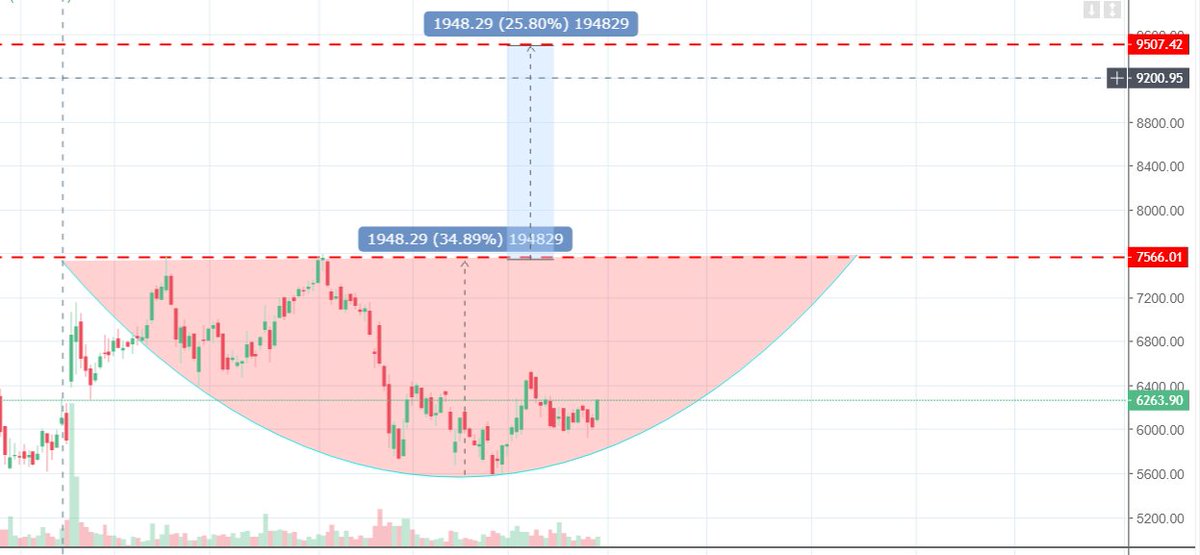
This is line chart based arc I plotted a few days ago to see where does the target of 2nd arc completes. We got ~9200(+/- 100/-) Switch to candles. See rejection area. Arc on candles is not really ideal but on line it is. No view above 9200! MAs need to catch up. #TATAELXSI pic.twitter.com/WNJRZZedrj
— Ameya (@Finstor85) March 30, 2022